

2.3 Position of the Group
There were no significant acquisition or divestment effects on consolidated and segment sales and EBITDA in the fiscal year 2023. There were also only minor negative currency effects at Group and segment level (mainly Business Applications segment) amounting to € 9.6 million for sales and € 2.5 million for EBITDA. The same applies to the Group’s asset position, for which there were no significant effects from currency fluctuations.
Group’s earnings position
In the fiscal year 2023, the total number of fee-based customer contracts in the United Internet Group was raised by a total of 1.03 million contracts, from 27.46 million to 28.49 million contracts.
Consolidated sales increased by 5.0% in the fiscal year 2023, from € 5,915.1 million in the previous year to € 6,213.2 million. Sales outside Germany improved by 5.0% from € 625.5 million to € 656.9 million (despite negative currency effects of € 9.6 million).
The cost of sales increased from € 3,906.3 million to € 4,145.1 million in the reporting period. Consequently, the cost of sales ratio rose from 66.0% (of sales) in the previous year to 66.7% (of sales) in 2023. This was due in part to a strong year-on-year increase in low-margin hardware sales in the Consumer Access segment. As a result, the gross margin fell from 34.0% to 33.3% and consequently the growth in gross profit of 3.0% from € 2,008.7 million to € 2,068.1 million fell short of sales growth (5.0%).
The rise in sales and marketing expenses was slightly below that of sales, from € 907.2 million (15.3% of sales) in the previous year to € 943.2 million (15.2% of sales), while the increase in administrative expenses from € 248.5 million (4.2% of sales) to € 275.9 million (4.4% of sales) was slightly in excess of sales growth.
This disproportionately strong rise in some of the above mentioned cost items results in part from increased expenditure for the rollout of 1&1’s mobile communications network, higher depreciation and amortization due to investments in the expansion of the fiber-optic network and mobile network, and strong increases in personnel expenses following an expansion of headcount as well as significant salary adjustments to keep pace with high inflation.
Multi-period overview: Development of key cost items
Cost of sales | 3,427.0 | 3,769.3 | 3,684.9 (1) | 3,906.3 | 4,145.1 |
Cost of sales ratio | 66.0% | 70.2% | 65.3% | 66.0% | 66.7% |
Gross margin | 34.0% | 29.8% | 34.7% | 34.0% | 33.3% |
Selling expenses | 741.8 | 767.9 | 835.7 | 907.2 | 943.2 |
Selling expenses ratio | 14.3% | 14.3% | 14.8% | 15.3% | 15.2% |
Administrative expenses | 205.9 | 206.0 | 243.0 | 248.5 | 275.9 |
Administrative expenses ratio | 4.0% | 3.8% | 4.3% | 4.2% | 4.4% |
in € million | 2019 | 2020 | 2021 | 2022 | 2023 |
(1) Including the non-period positive effect on earnings attributable to the second half of 2020 (EBITDA and EBIT effect: € +39.4 million)
Other operating expenses decreased from € 46.5 million in the previous year to € 33.3 million in 2023 and other operating income from € 92.3 million to € 60.6 million. Due to an increase in payment defaults, impairment losses on receivables and contract assets rose from € 117.4 million in the previous year to € 122.3 million in 2023.
Key earnings figures were influenced by two special items in the fiscal years 2023 and 2022:
- The special item “IPO costs IONOS” results from one-off costs in connection with the IPO of IONOS Group SE, as well as – with an opposing effect in 2023 – the partial assumption of costs by IONOS co-owner Warburg Pincus, and had an overall negative impact on EBITDA, EBIT, EBT, net income, and EPS in the fiscal years 2023 and 2022.
- The special item “non-cash valuation effect from derivatives“ results from quarterly revaluations of derivatives and had a negative impact on EBITDA, EBIT, EBT, net income, and EPS in the fiscal years 2023 and 2022.
Reconciliation of EBITDA, EBIT, EBT, net income, and EPS with figures adjusted for special items (operating)
EBITDA | 1,292.1 | 1,262.5 |
IPO costs IONOS | 1.7 | 8.8 |
Non-cash valuation effect from derivatives | 6.3 | 0.5 |
EBITDA adjusted for special items (operating) | 1,300.1 | 1,271.8 |
EBIT | 754.0 | 781.4 |
IPO costs IONOS | 1.7 | 8.8 |
Non-cash valuation effect from derivatives | 6.3 | 0.5 |
EBIT adjusted for special items (operating) | 762.0 | 790.7 |
EBT | 597.6 | 711.5 |
IPO costs IONOS | 1.7 | 8.8 |
Non-cash valuation effect from derivatives | 6.3 | 0.5 |
EBT adjusted for special items (operating) | 605.6 | 720.8 |
Net income | 362.2 | 464.7 |
IPO costs IONOS | 1.7 | 8.7 |
Non-cash valuation effect from derivatives | 4.4 | 0.4 |
Net income adjusted for special items (operating) | 368.3 | 473.8 |
Net income "Shareholders United Internet" | 232.7 | 367.2 |
IPO costs IONOS | 5.9 | 6.5 |
Non-cash valuation effect from derivatives | 4.4 | 0.4 |
Net income "Shareholders United Internet" adjusted for special items (operating) | 243.0 | 374.1 |
EPS | 1.35 | 1.97 |
IPO costs IONOS | 0.03 | 0.03 |
Non-cash valuation effect from derivatives | 0.03 | 0.00 |
EPS adjusted for special items (operating) | 1.41 | 2.00 |
in € million; EPS in € | Fiscal year 2023 | Fiscal year 2022 |
Adjusted for the above mentioned special items, the key performance measures EBITDA, EBIT, EBT, net income, and EPS for the fiscal year 2023 developed as follows:
Consolidated operating EBITDA rose by € 28.2 million (2.2%), from € 1,271.8 million in the previous year to € 1,300.1 million. This at first glance only moderate EBITDA growth was due in particular to planned increased costs for the construction of 1&1’s mobile communications network. In 2023, these rose to € -132.4 million, after € -52.4 million in the previous year.
Consolidated operating EBIT was additionally burdened by increased depreciation , especially for investments in the fiber-optic network and the mobile network (€ -71.3 million). As a result, it fell by € -28.7 million (-3.6%) from € 790.7 million to € 762.0 million. Since the beginning of 2024, t he increase in depreciation on investments – mainly due to the operational launch of 1&1’s mobile network – is being offset by steadily increasing cost savings on advance mobile services.
There was a corresponding fall in the operating EBITDA margin and the operating EBIT margin from 21.5% to 20.9% and from 13.4% to 12.3%, respectively.
The number of Group employees rose by 4.7% to 10,962 in 2023 (prior year: 10,474).
Key sales and earnings figures of the Group (in € million)
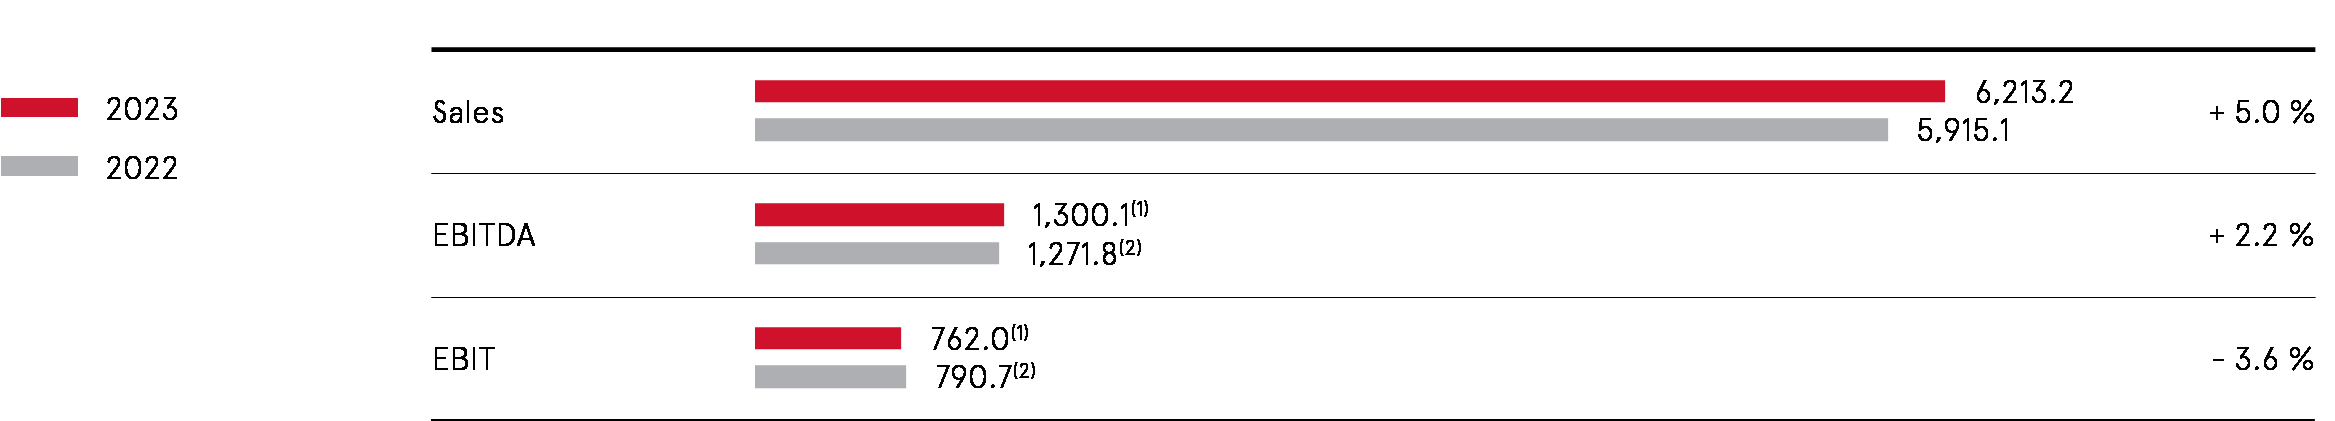
(1) Excluding a non-cash valuation effect from derivatives (EBITDA and EBIT effect: € -6.3 million) and excluding IPO costs IONOS (EBITDA and EBIT effect: € -1.7 million net (IPO costs and offsetting pro rata assumption of costs by the IONOS co-shareholder))
(2) Excluding a non-cash valuation effect from derivatives (EBITDA and EBIT effect: € -0.5 million) and excluding IPO costs IONOS (EBITDA and EBIT effect: € -8.8 million)
Quarterly development ; change over prior-year quarter (1)
Sales | 1,538.3 | 1,489.8 | 1,560.8 | 1,624.3 | 1,530.8 | + 6.1% |
EBITDA (2) | 319.0 | 351.1 | 325.8 | 304.2 | 285.3 | + 6.6% |
EBIT (2) | 188.9 | 219.6 | 191.0 | 162.5 | 165.5 | - 1.8% |
in € million | Q1 2023 | Q2 2023 | Q3 2023 | Q4 2023 | Q4 2022 | Change |
(1) Unaudited; see note “unaudited disclosures” on page 3
(2) Excluding a non-cash valuation effect from derivatives (EBITDA and EBIT effect: € -12.7 million in Q4 2022; € -4.5 million in Q1 2023; € +0.1 million in Q2 2023; € -0.9 million in Q3 2023; € -1.0 million in Q4 2023) and excluding IPO costs IONOS (EBITDA and EBIT effect: € -5.6 million in Q4 2022; € +0.5 million net (IPO costs and offsetting pro rata assumption of costs by the IONOS co-shareholder) in Q1 2023; € -2.1 million net in Q2 2023; € -0.1 million net in Q4 2023)
Multi-period overview: Development of key sales and earnings figures
Sales | 5,194.1 | 5,367.2 | 5,646.2 | 5,915.1 | 6,213.2 |
EBITDA | 1,244.2 (1) | 1,218.2 (2) | 1,262.4 (3) | 1,271.8 (4) | 1,300.1 (5) |
EBITDA margin | 24.0% | 22.7% | 22.4% | 21.5% | 20.9% |
EBIT | 770.2 (1) | 744.2 (2) | 788.6 (3) | 790.7 (4) | 762.0 (5) |
EBIT margin | 14.8% | 13.9% | 14.0% | 13.4% | 12.3% |
in € million | 2019 | 2020 | 2021 | 2022 | 2023 |
(1) Excluding extraordinary income from the sale of virtual minds shares (EBITDA and EBIT effect: € +21.5 million) and excluding trademark writeups Strato (EBIT effect: € +19.4 million)
(2) Including the non-period positive effect on earnings in 2021 attributable to the second half of 2020 (EBITDA and EBIT effect: € +39.4 million) and excluding write-off of VDSL contingents that are still available (EBITDA and EBIT effect: € -129.9 million)
(3) Excluding the non-period positive effect on earnings attributable to the second half of 2020 (EBITDA and EBIT effect: € +39.4 million), excluding a non-cash valuation effect from derivatives (EBITDA and EBIT effect: € +4.9 million) and excluding IPO costs IONOS (EBITDA and EBIT effect: € -3.0 million)
(4) Excluding a non-cash valuation effect from derivatives (EBITDA and EBIT effect: € -0.5 million) and excluding IPO costs IONOS (EBITDA and EBIT effect: € -8.8 million)
(5) Excluding a non-cash valuation effect from derivatives (EBITDA and EBIT effect: € -6.3 million) and excluding IPO costs IONOS (EBITDA and EBIT effect: € -1.7 million net (IPO costs and offsetting pro rata assumption of costs by the IONOS co-shareholder))
Due to the decline in operating EBIT as explained above, operating earnings before taxes (EBT) of € 605.6 million were also down on the previous year (€ 720.8 million). Likewise, operating consolidated net income and operating consolidated net income attributable to shareholders of United Internet AG fell from € 473.8 million to € 368.3 million and from € 374.1 million to € 243.0 million, respectively. In addition to the lower EBIT result (€ -28.7 million), this decline in the key operating figures was mainly due to a year-on-year decrease in the result from associated companies (€ -26.4 million) and the financial result (€ -60.0 million). The latter was impacted by the increase in interest rates.
Without consideration of the valuation effects from derivatives and the IONOS IPO costs (total EPS effect: € -0.06; prior year: € -0.03 ), operating EPS in the fiscal year 2023 declined from € 2.00 in the prior-year period to € 1.41 . In addition to the decrease in EBIT (EPS effect: € -0.13 ), this was also due to a lower result from associated companies (EPS effect: € -0.16 ), and the lower financial result (EPS effect: € -0.30 ).
Group’s financial position
Despite the decline in net income, operative cash flow rose slightly from € 1,010.7 million (1) in the previous year to € 1,018.0 million in the fiscal year 2023.
Cash flow from operating activities increased to € 828.5 million (prior year: € 616.4 million (1) – incl. phasing effects of € -97.2 million from Q4 2021). The increase mainly results from the change in trade accounts payable.
Cash flow from investing activities in the reporting period led to a net outflow of € -798.2 million (prior year: € -701.6 million (1) ). This resulted mainly from capital expenditures of € -797.9 million (prior year: € -681.4 million).
United Internet’s free cash flow is defined as cash flow from operating activities, less capital expenditures, plus payments from disposals of intangible assets and property, plant, and equipment. Free cash flow in the fiscal year 2023 amounted to € 36.4 million (prior year: € -60.5 million (1) – incl. phasing effects). After deducting the cash flow item “Redemption of lease liabilities” – disclosed in cash flow from financing activities since the initial application of the accounting standard IFRS 16 – free cash flow (after leasing) amounted to € -85.0 million (prior year: € -173.2 million (1) ).
Cash flow from financing activities in the fiscal year 2023 was dominated by the purchase of treasury shares (€ -291.9 million; prior year: € 0), the net assumption of loans (€ +305.2 million; prior year: € +328.6 million (1) ), payments for interest (€ -91.0 million; prior year: € -30,2 million (1) ), the redemption of lease liabilities (€ -121.3 million; prior year: € -112.6 million), dividend payments (€ -86.4 million; prior year: € -93.4 million), and payments received from minority shareholders (€ 305.0 million; prior year: € -15.2 million disbursement) in connection with the IPO of IONOS Group SE as well as from purchase price payments made by Warburg Pincus.
As of December 31, 2023, cash and cash equivalents amounted to € 27.7 million – compared to € 40.5 million on the same date last year.
Development of key cash flow figures
Operative cash flow | 1,018.0 | 1,010.7 | + 7.3 |
Cash flow from operating activities | 828.5 | 616.4 | + 212.1 |
Cash flow from investing activities | -798.2 | -701.6 | - 96.6 |
Free cash flow (2) | -85.0 (3) | -173.2 (4) | + 88.2 |
Cash flow from financing activities | -43.6 | 14.2 | - 57.8 |
Cash and cash equivalents on December 31 | 27.7 | 40.5 | - 12.8 |
in € million | 2023 | 2022 (1) | Change |
(1) With regard to the changes in the presentation of the cash flow statement, reference is made to the explanations in the notes to the consolidated financial statements under note 46
(2) Free cash flow is defined as cash flow from operating activities, less capital expenditures, plus payments from disposals of intangible assets and property, plant and equipment
(3) 2023 including the repayment portion of lease liabilities (€ 121.3 million), which have been reported under cash flow from financing activities since the fiscal year 2019 (IFRS 16)
(4) 2022 including the repayment portion of lease liabilities (€ 112.6 million), which have been reported under cash flow from financing activities since the fiscal year 2019 (IFRS 16)
For further details on guarantees, leases, and other financial obligations, please refer to chapter 2.2 “Business development”, “Liquidity and finance”, as well as note 45 of the Notes to the Consolidated Financial Statements.
Group’s asset position
The balance sheet total increased from € 10.358 billion as of December 31, 2022 to € 11.246 billion on December 31, 2023.
Development of current assets
Cash and cash equivalents | 27.7 | 40.5 | - 12.8 |
Trade accounts receivable | 508.9 | 418.8 | + 90.1 |
Contract assets | 676.1 | 648.4 | + 27.7 |
Inventories | 178.1 | 120.6 | + 57.5 |
Prepaid expenses | 303.8 | 282.1 | + 21.7 |
Other financial assets | 96.9 | 106.6 | - 9.7 |
Income tax claims | 34.8 | 34.7 | + 0.0 |
Other non-financial assets | 13.8 | 19.7 | - 5.9 |
Total current assets | 1,840.1 | 1,671.4 | + 168.7 |
in € million | Dec. 31, 2023 | Dec. 31, 2022 | Change |
Current assets rose from € 1,671.4 million as of December 31, 2022 to € 1,840.1 million on December 31, 2023. However, cash and cash equivalents disclosed under current assets decreased from € 40.5 million to € 27.7 million due to closing-date effects. Likewise, trade accounts receivable fell from € 418.8 million to € 508.9 million due to closing-date effects. As a result of customer growth, the item current contract assets rose from € 648.4 million to € 676.1 million and includes current claims against customers due to accelerated revenue recognition from the application of IFRS 15. In order to avoid supply bottlenecks, inventories were raised from € 120.6 million to € 178.1 million. Due to prepayments made to advance service providers and closing-date effects, current prepaid expenses increased from € 282.1 million to € 303.8 million and mainly comprise the short-term portion of expenses relating to contract acquisition and contract fulfillment according to IFRS 15. The items current other financial assets, income tax claims, and other non-financial assets were largely unchanged.
Development of non-current assets
Shares in associated companies | 373.2 | 429.3 | - 56.1 |
Other financial assets | 8.3 | 10.7 | - 2.4 |
Property, plant and equipment | 2,405.3 | 1,851.0 | + 554.3 |
Intangible assets | 2,001.6 | 2,029.3 | - 27.7 |
Goodwill | 3,628.8 | 3,623.4 | + 5.4 |
Trade accounts receivable | 34.8 | 41.4 | - 6.6 |
Contract assets | 206.6 | 216.7 | - 10.1 |
Prepaid expenses | 679.8 | 429.0 | + 250.8 |
Deferred tax assets | 67.1 | 56.3 | + 10.8 |
Total non-current assets | 9,405.6 | 8,687.1 | + 718.5 |
in € million | Dec. 31, 2023 | Dec. 31, 2022 | Change |
Non-current assets rose strongly from € 8,687.1 million as of December 31, 2022 to € 9,405.6 million on December 31, 2023. Due in particular to the deterioration in the pro rata result of investments (mainly Kublai / Tele Columbus), shares in associated companies fell from € 429.3 million to € 373.2 million. Capital expenditures in the reporting period (especially for the 5G network rollout and expansion of the fiber-optic network in the Consumer Access and Business Access segments) led to a strong increase in property, plant and equipment from € 1,851.0 million to € 2,405.3 million, while intangible assets declined from € 2,029.3 million to € 2,001.6 million mainly as a result of amortization. Due to prepayments made to advance service providers and closing-date effects, non-current prepaid expenses rose strongly from € 429.0 million to € 679.8 million. The items non-current other financial assets , goodwill , non-current trade accounts receivable, non-current contract assets , and deferred tax assets were largely unchanged.
Development of current liabilities
Trade accounts payable | 699.2 | 561.5 | + 137.7 |
Liabilities due to banks | 582.4 | 656.7 | - 74.3 |
Income tax liabilities | 88.0 | 52.7 | + 35.3 |
Contract liabilities | 175.0 | 157.1 | + 17.9 |
Other accrued liabilities | 26.4 | 5.1 | + 21.3 |
Other financial liabilities | 322.0 | 333.6 | - 11.6 |
Other non-financial liabilities | 129.6 | 69.0 | + 60.7 |
Total current liabilities | 2,022.7 | 1,835.6 | + 187.1 |
in € million | Dec. 31, 2023 | Dec. 31, 2022 | Change |
Current liabilities increased from € 1,835.6 million as of December 31, 2022 to € 2,022.7 million on December 31, 2023. Due to closing-date effects, current trade accounts payable increased from € 561.5 million to € 699.2 million. There was a decrease in current liabilities due to banks from € 656.7 million to € 582.4 million as a result of the reduction of short-term liabilities. Current other non-financial liabilities increased from € 69.0 million to € 129.6 million and mainly include liabilities due to tax authorities as of the respective balance sheet date. The items income tax liabilities and current contract liabilities (which mainly include payments received from customer contracts for which the performance has not yet been completely rendered), as well as current other accrued liabilities , and current other financial liabilities were all virtually unchanged.
Development of non-current liabilities
Liabilities due to banks | 1,881.9 | 1,498.8 | + 383.0 |
Deferred tax liabilities | 293.0 | 309.7 | - 16.7 |
Trade accounts payable | 3.4 | 4.3 | - 0.9 |
Contract liabilities | 32.7 | 31.3 | + 1.4 |
Other accrued liabilities | 68.7 | 67.1 | + 1.6 |
Other financial liabilities | 1,388.3 | 1,313.3 | + 75.0 |
Total non-current liabilities | 3,667.9 | 3,224.5 | + 443.4 |
in € million | Dec. 31, 2023 | Dec. 31, 2022 | Change |
Non-current liabilities increased from € 3,224.5 million as of December 31, 2022 to € 3,667.9 million on December 31, 2023. This was mainly due to non-current liabilities due to banks , which rose from € 1,498.8 million to € 1,881.9 million, largely as a result of the assumption of a promissory note loan totaling € 300 million. As a result of higher leasing additions (IFRS 16), other financial liabilities rose from € 1,313.3 million to € 1,388.3 million. The items deferred tax liabilities , non-current trade accounts payable , non-current contract liabilities , as well as non-current other accrued liabilities were largely unchanged.
Development of equity
Capital stock | 192.0 | 194.0 | - 2.0 |
Capital reserves | 2,197.7 | 1,966.2 | + 231.6 |
Accumulated profit | 2,980.5 | 2,835.8 | + 144.7 |
Treasury shares | -459.8 | -231.5 | - 228.3 |
Revaluation reserves | 0.1 | 1.3 | - 1.2 |
Currency translation adjustment | -12.5 | -15.7 | + 3.2 |
Equity attributable to shareholders of the parent company | 4,898.0 | 4,750.1 | + 147.9 |
Non-controlling interests | 657.0 | 548.3 | + 108.7 |
Total equity | 5,555.1 | 5,298.4 | + 256.7 |
in € million | Dec. 31, 2023 | Dec. 31, 2022 | Change |
Consolidated equity capital rose from € 5,298.4 million as of December 31, 2022 to € 5,555.1 million on December 31, 2023. The Group’s accumulated profit – comprising the past profits of the consolidated companies, insofar as they were not distributed – rose from € 2,835.8 million to € 2,980.5 million in the fiscal year 2023. At the same time, capital reserves rose from € 1,966.2 million to € 2,197.7 million due to the sale of shares during the IONOS IPO with an opposing effect from the cancellation of treasury shares. As a result of the share buyback explained below, there was an increase in the value of treasury shares from € -231.5 million to € -459.8 million. Treasury shares are deducted from equity capital. The consolidated equity ratio fell slightly from 51.2% to 49.4%.
As of December 31, 2022, United Internet AG held a total of 7,284,109 treasury shares, corresponding to approx. 3.75% of the capital stock at the time of 194,000,000 shares. On February 14, 2023, the Management Board of United Internet AG decided, with the approval of the Supervisory Board and on the basis of the authorization granted by the Annual Shareholders' Meeting of May 20, 2020 regarding the acquisition and use of treasury shares, to initially cancel two million treasury shares and to reduce the capital stock of United Internet AG from € 194 million to € 192 million. The number of shares issued decreased accordingly from 194 million shares to 192 million shares. The pro-rata amount of capital stock per issued share remained unchanged at € 1. The cancellation of the treasury shares serves to increase the proportionate participation of United Internet shareholders. Following the cancellation of the aforementioned two million shares, United Internet AG initially held 5,284,109 treasury shares. This corresponded to approx. 2.75% of the Company’s current capital stock.
Furthermore, the Management Board of United Internet AG also decided on February 14, 2023, with the approval of the Supervisory Board, to make a public share buyback offer to the shareholders of United Internet AG for a total of up to 13.9 million shares at a price of € 21.00 per share. The total volume of the share buyback offer therefore amounted to up to € 291.9 million. With the public share buyback offer, United Internet AG made use of the authorization granted by the Annual Shareholders' Meeting of the Company on May 20, 2020, under which up to 10% of the Company’s capital stock could be bought back by August 31, 2023. The shares bought back may be used for all of the purposes permitted under the authorization granted by the Annual Shareholders' Meeting of May 20, 2020. The shares may also be canceled.
In the course of the public share buyback offer, a total of 27,553,147 shares were tendered to the Company by the end of the offer period. The offer was based on the buyback of up to 13.9 million shares in total. As the total number of shares for which the offer was accepted exceeded this maximum amount, the declarations of acceptance were considered on a pro rata basis, i.e., corresponding to the ratio of the maximum number of United Internet shares to be purchased pursuant to this offer, i.e., 13.9 million United Internet shares, to the aggregate number of United Internet shares tendered by United Internet shareholders for buyback.
Upon completion of the above mentioned capital reduction by means of canceling two million treasury shares, and the buyback of 13,899,596 shares (without fractional amounts) as part of the public share buyback offer to the shareholders of United Internet AG, United Internet holds 19,183,705 treasury shares as of December 31, 2023, corresponding to 9.99% of the current capital stock of 192 million shares. In view of the offer price of € 21.00 per United Internet share, the purchase price for the buyback of 13,899,596 shares in total amounted to € 291.9 million and thus corresponded approximately to the sales proceeds of United Internet from the IONOS IPO.
Due mainly to investments in intangible assets and property, plant and equipment (€ -797.9 million, of which € -41.9 million for the acquisition of the BT city networks), as well as the contingent payment for advance services to Deutsche Telekom (€ -276.5 million), and the dividend payment (€ -86.4 million), net bank liabilities (i.e., the balance of bank liabilities and cash and cash equivalents) increased from € 2,115.0 million as of December 31, 2022 to € 2,436.6 million on December 31, 2023.
In the second quarter of 2023, United Internet AG successfully placed a promissory note loan totaling € 300 million. The proceeds from this transaction are used for general company funding. Moreover, in December 2023, the subsidiary IONOS Group SE concluded a loan of € 800 million with a banking syndicate to partially refinance its existing shareholder loan with United Internet AG. Following the partial repayment, the shareholder loan with United Internet amounts to € 350 million.
Multi-period overview: development of relative indebtedness
Net bank liabilities (1) / EBITDA | 1.28 | 1.27 | 1.31 | 1.68 | 1.89 |
Dec. 31, 2019 | Dec. 31, 2020 | Dec. 31, 2021 | Dec. 31, 2022 | Dec. 31, 2023 |
(1) Net bank liabilities = balance of bank liabilities and cash and cash equivalents
Further details on the objectives and methods of the Group’s financial risk management are provided under note 43 of the Notes to the Consolidated Financial Statements.
Multi-period overview: development of key balance sheet items
Total assets | 9,128.8 | 9,230.8 | 9,669.1 | 10,358.5 | 11,245.6 | ||||
Cash and cash equivalents | 117.6 | 131.3 | 110.1 | 40.5 | 27.7 | ||||
Shares in associated companies | 196.0 | 89.6 (1) | 431.6 (1) | 429.3 | 373.2 | ||||
Other financial assets | 90.4 | 9.9 (2) | 11.6 | 10.7 | 8.3 | ||||
Property, plant and equipment | 1,160.6 | 1,271.6 | 1,379.6 | 1,851.0 | 2,405.3 | ||||
Intangible assets | 2,167.4 | 2,197.8 | 2,059.4 | 2,029.3 | 2,001.6 | ||||
Goodwill | 3,616.5 | 3,609.4 | 3,627.8 | 3,623.4 | 3,628.8 | ||||
Liabilities due to banks | 1,738.4 | 1,466.1 | 1,822.7 | 2,155.5 | 2,464.3 | ||||
Capital stock | 205.0 | 194.0 (3) | 194.0 | 194.0 | 192.0 (3) | ||||
Equity | 4,614.7 | 4,911.2 | 4,923.2 | 5,298.4 | 5,555.1 | ||||
Equity ratio | 50.6% | 53.2% | 50.9% | 51.2% | 49.4% | ||||
in € million | Dec. 31, 2019 | Dec. 31, 2020 | Dec. 31, 2021 | Dec. 31, 2022 | Dec. 31, 2023 | ||||
(1) Decrease due to reclassification Tele Columbus (2020); increase due to stake in Kublai (2021)
(2) Decrease due to sale of Afilias shares (2020)
(3) Decrease due to withdrawal of treasury shares (2020 and 2023)
Management Board’s overall assessment of the Group’s business situation
The International Monetary Fund (IMF) upgraded its forecast for 2023 slightly during the course of the year. In its latest economic outlook, the IMF reported growth of 3.1% for the global economy in 2023, based on preliminary calculations. Growth was thus below the prior-year level (3.5%) but at the same time 0.2 percentage points above the IMF’s original outlook in January 2023 (2.9%).
The IMF’s calculations for Germany are in line with the preliminary figures of the country’s Federal Statistical Office (Destatis), which – at its “GDP 2023” press conference on January 15, 2024 – announced a decline in (price-adjusted) gross domestic product (GDP) of -0.3% for 2023. This is 2.1 percentage points less than in 2022 (1.8%). According to the Federal Statistical Office, this was due to further inflation-related high prices throughout the economy, unfavorable borrowing conditions caused by rising interest rates and an overall decline in both domestic and foreign demand.
Thanks to its stable and largely non-cyclical business model, United Internet made good progress again in the fiscal year 2023 – despite the aforementioned adverse macroeconomic conditions. The Company was able to achieve the sales and earnings targets it set itself, continuing its successful development with an increase in fee-based customer contracts of over 1 million to 28.49 million and sales growth of 5.0% to € 6.213 billion. At the same time, there was a further improvement in operating EBITDA – despite heavy investment in future topics – with an increase of 2.2% to around € 1.300 billion. This at first glance only moderate EBITDA growth was due in particular to planned increased costs for the construction of 1&1’s mobile communications network. These rose to € -132.4 million, compared to € -52.4 million in the previous year – a year-on-year increase of € -80.0 million.
The positive performance once again highlights the benefits of United Internet’s business model based predominantly on electronic subscriptions with fixed monthly payments. This ensures stable and predictable revenues and cash flows, offers protection against cyclical influences and provides the financial scope to win new customers, expand existing customer relationships, and grasp opportunities in new business fields and new markets – organically or via investments and acquisitions.
In the fiscal year 2023, the Company once again invested heavily in gaining and expanding customer relationships, as well as in developing new products – thus laying the basis for future growth.
As of the reporting date for the Annual Financial Statements 2023, and at the time of preparing this Management Report, the Management Board believes that the United Internet Group as a whole is well placed for its further development. It regards the financial position and performance – subject to possible special items – as positive and is optimistic about the Group’s future prospects.