

2.3 Position of the Group
There were no significant acquisition or divestment effects on consolidated and segment sales and EBITDA in the fiscal year 2020. There were also only minor negative currency effects at Group and segment level (Business Access segment) amounting to € -4.1 million for sales and € -1.3 million for EBITDA. The same applies to the Group’s asset position, for which there were no significant effects from currency fluctuations.
Group’s earnings position
In the fiscal year 2020, the total number of fee-based customer contracts in the United Internet Group was raised by 910,000 to 25.65 million contracts. At the same time, ad-financed free accounts rose by 1.81 million to 39.40 million.
Consolidated sales grew organically by 3.3% in the fiscal year 2020, from € 5,194.1 million in the previous year to € 5,367.2 million. Growth was impeded by the effects of the coronavirus pandemic. These effects had a particularly negative impact on the Consumer Access and Consumer Applications segments. There were opposing positive effects in the Business Access segment. Adjusted for these pandemic effects of € -25.1 million in total (compared to planning), like-for-like sales rose by 3.8%.
All four business segments contributed to this revenue growth, whereby hardware sales to existing customers in the Consumer Access segment were below target in the third and fourth quarters of 2020 (due to fewer tariff changes). The sale of devices is generally a low-margin business as customers pay no or only a low one-off price when they sign a contract or change tariffs and the device costs are refinanced via higher tariff prices. This business fluctuates seasonally and depends heavily on the attractiveness of new devices and manufacturers’ model cycles.
Despite slightly negative currency effects of € 4.1 million, sales outside Germany improved by 5.9% from € 433.0 million in the previous year to € 458.5 million in the fiscal year 2020.
The increase in cost of sales was mainly due to the one-off, non-cash write-off of VDSL contingents. In addition, there was increased use of hardware, additional burdens on earnings from regulatory decisions, as well as extra costs for wholesale mobile communication purchases due to the coronavirus pandemic and the price increase for using Telefónica’s network capacity. In view of these factors, there was a disproportionately strong increase in cost of sales from € 3,427.0 million (66.0% of sales) in the previous year to € 3,769.3 million (70.2% of sales).
There was a corresponding decline in the gross margin from 34.0% to 29.8%. As a result, gross profit decreased from € 1,767.1 million to € 1,597.9 million. Adjusted for the above mentioned write-off of VDSL contingents (€ 129.9 million), the gross margin amounted to 32.2% and gross profit to € 1,727.8 million.
Sales and marketing expensesincreased in line with sales, from € 741.8 million (14.3% of sales) in the previous year to € 767.9 million (14.3% of sales). This figure includes (as of July 2020) sponsoring expenses for the partnership with Borussia Dortmund (1&1 is exclusive Bundesliga main and jersey sponsor of BVB).
Despite the expansion of business (+3.3% sales growth), administrative expenses of € 206.0 million (3.8% of sales) were almost unchanged from the previous year (€ 205.9 million; 4.0% of sales).
Multi-period overview: Development of key cost items
in € million | 2016 | 2017 | 2018(1) | 2019(1) | 2020 |
Cost of sales | 2,461.8 | 2,691.1 | 3,350.1 | 3,427.0 | 3,769.3 |
Cost of sales ratio | 64.6% | 64.0% | 65.7% | 66.0% | 70.2% |
Gross margin | 35.4% | 36.0% | 34.3% | 34.0% | 29.8% |
Selling expenses | 521.2 | 638.3 | 678.2 | 741.8 | 767.9 |
Selling expenses ratio | 13.7% | 15.2% | 13.3% | 14.3% | 14.3% |
Administrative expenses | 182.9 | 185.1 | 218.9 | 205.9 | 206.0 |
Administrative expenses ratio | 4.8% | 4.4% | 4.3% | 4.0% | 3.8% |
(1 ) 2018 and 2019 adjusted as part of the financial statements 2019
Other operating expenses rose from € 17.0 million to € 30.9 million, while other operating income decreased from € 102.9 million in the previous year (including income from the sale of virtual minds shares totaling € 21.5 million) to € 74.5 million. Impairment losses on receivables and contract assets amounted to € -92.9 million (prior year: € -94.2 million).
Key earnings figures were influenced by various special items in the fiscal years 2019 and 2020, which in total had a net negative effect in the fiscal year 2020 and a positive effect in the fiscal year 2019.
Special items 2020
- The special item “write-off of VDSL contingents 2020” results from the derecognition of accrued assets for VDSL contingents still available. In the fiscal year 2020, it had a negative effect on EBITDA, EBIT, EBT, net income, and EPS.
- Details are provided in chapter 2 “Economic report” under “Legal conditions / significant events”.
- The special item “Impairment reversals Tele Columbus 2020” results from the impairment reversal of shares in Tele Columbus AG held by United Internet and disclosed in the result from associated companies. In the fiscal year 2020, it had a positive effect on EBT, net income, and EPS.
Special items 2019
- The special item “Sale of virtual minds shares 2019”results from extraordinary income from the sale of shares in virtual minds and had a positive effect on EBITDA, EBIT, EBT, net income, and EPS in the fiscal year 2019.
- The special item “Trademark writeups STRATO 2019” results from trademark writeups on the “STRATO” brand and had a positive effect on EBIT, EBT, net income, and EPS in the fiscal year 2019.
- The special item “Impairment reversals Tele Columbus 2019” results from the impairment reversal of shares in Tele Columbus AG held by United Internet and disclosed in the result from associated companies. In the fiscal year 2019, it had a positive effect on EBT, net income, and EPS.
Reconciliation of EBITDA, EBIT, EBT, net income, and EPS with figures adjusted for special items
in € million; EPS in € | Fiscal year 2020 | Fiscal year 2019 |
EBITDA | 1,048.9 | 1,265.7 |
Write-off VDSL contingents 2020 | 129.9 | |
Sale of virtual minds shares 2019 | -21.5 | |
EBITDA before special items (operating) | 1,178.8 | 1,244.2 |
EBIT | 574.9 | 811.1 |
Write-off VDSL contingents 2020 | 129.9 | |
Sale of virtual minds shares 2019 | -21.5 | |
Trademark writeups Strato 2019 | -19.4 | |
EBIT before special items (operating) | 704.8 | 770.2 |
EBT | 556.2 | 779.7 |
Write-off VDSL contingents 2020 | 129.9 | |
Impairment reversals Tele Columbus 2020 | -29.2 | |
Sale of virtual minds shares 2019 | -21.5 | |
Trademark writeups Strato 2019 | -19.4 | |
Impairment reversals Tele Columbus 2019 | -18.5 | |
EBT before special items (operating) | 656.9 | 720.3 |
Net income | 368.8 | 539.0 |
Write-off VDSL contingents 2020 | 91.5 | |
Impairment reversals Tele Columbus 2020 | -29.2 | |
Sale of virtual minds shares 2019 | -21.1 | |
Trademark writeups Strato 2019 | -13.5 | |
Impairment reversals Tele Columbus 2019 | -18.5 | |
Net income before special items (operating) | 431.1 | 485.9 |
Net income "Shareholders United Internet" | 290.5 | 423.9 |
Write-off VDSL contingents 2020 | 68.9 | |
Impairment reversals Tele Columbus 2020 | -29.2 | |
Sale of virtual minds shares 2019 | -21.1 | |
Trademark writeups Strato 2019 | -9.0 | |
Impairment reversals Tele Columbus 2019 | -18.5 | |
Net income "Shareholders United Internet" before special items (operating) | 330.2 | 375.3 |
EPS | 1.55 | 2.13 |
Write-off VDSL contingents 2020 | 0.37 | |
Impairment reversals Tele Columbus 2020 | -0.16 | |
Sale of virtual minds shares 2019 | -0.11 | |
Trademark writeups Strato 2019 | -0.05 | |
Impairment reversals Tele Columbus 2019 | -0.09 | |
EPS before special items (operating) | 1.76 | 1.88 |
Without consideration of the above mentioned opposing special items, the key performance measures EBITDA, EBIT, EBT, net income, and EPS for the fiscal year 2020 developed as follows:
There was a significant year-on-year decrease in consolidated operating EBITDA of 5.3% to € 1,178.8 million in the fiscal year 2020 (prior year: € 1,244.2 million).
This decline was mainly due to the price increase introduced by Telefónica Germany on July 1, 2020 for the use of Telefónica’s network capacity. Details are provided in chapter 2 “Economic report” under “Legal conditions / significant events”.
In addition to this price rise, which will be reduced retroactively by € 34.4 million on conclusion of the national roaming agreement (out-of-period recognition in fiscal 2021), earnings were burdened by negative effects from regulatory decisions of the EU on SMS tariffs (since May 15, 2019) and of Germany’s Federal Network Agency regarding subscriber line charges (since July 1, 2019) with a total impact of € -13.7 million. Moreover, the initial costs for the construction of the Company’s own 5G mobile communications network rose to € -13.9 million (prior year: € -5.7 million). By contrast, the one-off costs for integration projects declined to € -1.1 million (prior year: € -3.2 million). On top of this, the coronavirus pandemic also burdened earnings by a total of € -27.2 million in the fiscal year 2020 (compared to planning). The negative impact on both the Consumer Access and Consumer Applications segments was offset in part by slightly positive effects in the Business Access segment. Adjusted for the aforementioned negative effects, like-for-like EBITDA of € 1,269.1 million was 1.3% above the prior-year figure (€ 1,253.1 million).
As a result of theabove mentioned burdens on earnings, consolidated operating EBIT of € 704.8 million was also below the prior-year figure (€ 770.2 million). Adjusted for these effects, like-for-like EBIT increased by 2.1%.
Key sales and earnings figures of the Group (in € million)
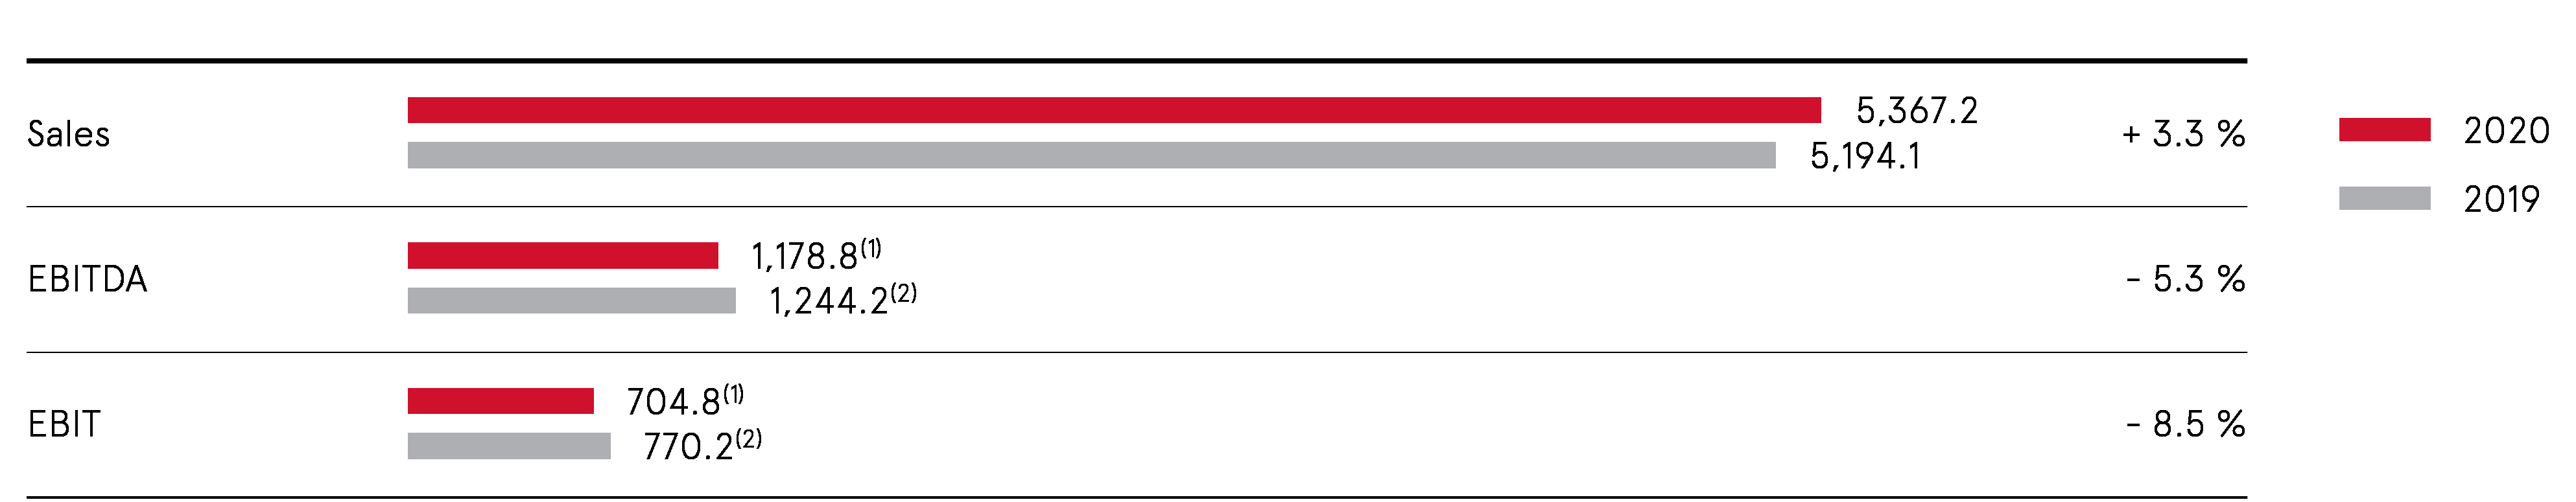
(1) Including one-off expenses for integration projects (EBITDA and EBIT effect: € -1.1 million); excluding write-off of VDSL contingents that are still available (EBITDA and EBIT effect: € -129.9 million)
(2) Including one-off expenses for integration projects (EBITDA and EBIT effect: € -3.2 million); excluding extraordinary income from the sale of virtual minds shares (EBITDA and EBIT effect: € +21.5 million); excluding trademark writeups Strato (EBIT effect: € +19.4 million)
Quarterly development; change over prior-year quarter
in € million | Q1 2020 | Q2 2020 | Q3 2020 | Q4 2020 | Q4 2019 | Change |
Sales | 1,329.4 | 1,328.5 | 1,326.8 | 1,382.5 | 1,339.1 | + 3.2% |
EBITDA | 300.8(1) | 319.7(2) | 275.9(3) | 282.4(4) | 321.7(5) | -12.2% |
EBIT | 184.2(1) | 201.2(2) | 156.3(3) | 163.1(4) | 204.1(5) | -20.1% |
(1) Including one-off expenses for integration projects (EBITDA and EBIT effect: € -0.3 million)
(2) Including one-off expenses for integration projects (EBITDA and EBIT effect: € -0.1million)
(3) Including one-off expenses for integration projects (EBITDA and EBIT effect: € -0.3 million)
(4) Including one-off expenses for integration projects (EBITDA and EBIT effect: € -1.1 million); excluding write-off of VDSL contingents that are still available (EBITDA and EBIT effect: € -129.9 million)
(5) Including one-off expenses for integration projects (EBITDA and EBIT effect: € +0.6 million); excluding trademark writeups Strato (EBIT effect: € +19.4 million)
Multi-period overview: development of key sales and earnings figures
in € million | 2016 | 2017 | 2018 | 2019 | 2020 |
Sales | 3,808.1 | 4,206.3 | 5,102.9 | 5,194.1 | 5,367.2 |
EBITDA | 835.4 | 979.6(1) | 1,201.3(2) | 1,244.2(3) | 1,178.8(4) |
EBITDA margin | 21.9% | 23.3% | 23.5% | 24.0% | 22.0% |
EBIT | 642.7 | 704.0(1) | 811.0(2) | 770.2(3) | 704.8(4) |
EBIT margin | 16.9% | 16.7% | 15.9% | 14.8% | 13.1% |
(2) Without extraordinary income from revaluation of Drillisch shares (EBITDA and EBIT effect: € +303.0 million) and revaluation of ProfitBricks shares (EBITDA and EBIT effect: € +16.1 million), as well as without M&A transaction costs (EBITDA and EBIT effect: € -17.1 million), without restructuring charges in offline sales (EBITDA and EBIT effect: € -28.3 million) and without trademark writedowns Strato (EBIT effect: € -20.7 million)
(2) Including one-off expenses for integration projects (EBITDA and EBIT effect: € -25.1 million)
(3) Including one-off expenses for integration projects (EBITDA and EBIT effect: € -3.2 million); excluding extraordinary income from the sale of virtual minds shares (EBITDA and EBIT effect: € +21.5 million); excluding trademark writeups Strato (EBIT effect: € +19.4 million)
(4) Including one-off expenses for integration projects (EBITDA and EBIT effect: € -1.1 million); excluding write-off of VDSL contingents that are still available (EBITDA and EBIT effect: € -129.9 million)
Due to theabove mentioned burdens on earnings, operating earnings before taxes (EBT) and operating consolidated net income of € 656.9 million (prior year: € 720.3 million) and € 431.1 million (prior year: € 485.9 million), respectively, fell short of the corresponding prior-year figures.
The operating consolidated net income attributable to shareholders of United Internet AG also fell from € 375.3 million to € 330.2 million.
There was also a corresponding decrease in operatingearnings per share (EPS) from € 1.88 in the previous year to € 1.76.
Group’s financial position
Based on net income of € 368.8 million (prior year: € 539.0 million), operative cash flow rose from € 935.0 million to € 954.1 million in the fiscal year 2020.
Cash flow from operating activities in 2020 increased from € 828.9 million in the previous year to € 925.7 million. This strong increase was mainly due to cash outflows after the balance sheet date for wholesale services received.
Cash flow from investing activities in the reporting period resulted in net outflows of € 361.1 million (prior year: net inflows of € 87.2 million). This was mainly due to disbursements of € 447.0 million for capital expenditures, € 165.0 million of which for the first five-year extension phase of the existing MBA MVNO agreement with Telefónica which began on July 1, 2020, with an opposing effect from payments received for the disposal of financial assets (especially the sale of shares (9.82%) in Afilias Inc.) amounting to € 77.5 million. Cash flow from investing activities in the previous year was dominated by disbursements of € 252.8 million for capital expenditures and – with an opposing effect – proceeds from the sale of associated companies (mainly from the sale of shares in virtual minds) amounting to € 35.6 million, as well as proceeds from the sale of financial assets (especially the sale of Rocket Internet shares) amounting to € 303.7 million.
United Internet’s free cash flow is defined as cash flow from operating activities, less capital expenditures, plus payments from disposals of intangible assets and property, plant, and equipment. Due to the strong increase in capital expenditures (especially the payment of € 165.0 million for the extension phase of the MBA MVNO agreement), free cash flow fell from € 607.0 million in the previous year (excluding tax payments for fiscal year 2017 and previous years of € 22.1 million) to € 483.8 million. Since the initial application of the accounting standard IFRS 16 in the fiscal year 2019, the redemption share of lease liabilities is disclosed in cash flow from financing activities. After deducting the cash flow item “Redemption of lease liabilities”, free cash flow fell from € 496.0 million in the previous year (without the above mentioned tax payment) to € 376.6 million in the fiscal year 2020.
Cash flow from financing activities in the fiscal year 2020 was dominated by the purchase of treasury shares totaling € 12.2 million (prior year: € 373.6 million), net loan repayments of € 272.3 million (prior year: € 200.8 million), the redemption of frequency liabilities totaling € 61.3 million (prior year: € 61.3 million), the redemption of lease liabilities of € 107.2 million (prior year: € 111.0 million), and the dividend payment of € 93.6 million (prior year: € 10.0 million).
Cash and cash equivalents amounted to € 131.3 million as of December 31, 2020 – due to closing-date effects – compared to € 117.6 million on the same date in the previous year.
Development of key cash flow figures
in € million | 2020 | 2019 | Change |
Operative cash flow | 954.1 | 935.0 | + 19.1 |
Cash flow from operating activities | 925.7 | 828.9 | + 96.8 |
Cash flow from investing activities | -361.1 | 87.2 | -448.3 |
Free cash flow(1) | 376.6(2) | 496.0(3) | -119.4 |
Cash flow from financing activities | -549.1 | -857.6 | + 308.5 |
Cash and cash equivalents on December 31 | 131.3 | 117.6 | + 13.7 |
(1) Free cash flow is defined as cash flow from operating activities, less capital expenditures, plus payments from disposals of intangible assets and property, plant and equipment
(2) 2020 including the repayment portion of lease liabilities (€ 107.2 million), which have been reported under cash flow from financing activities since the fiscal year 2019 (IFRS 16)
(3) 2019 without consideration of tax payments from fiscal year 2017 and previous years (€ 22.1 million); incl. the repayment portion of lease liabilities (€ 111.0 million), which have been reported under cash flow from financing activities since the fiscal year 2019 (IFRS 16)
Multi-period overview: development of key cash flow figures
in € million | 2016 | 2017 | 2018 | 2019 | 2020 |
Operative cash flow | 644.2 | 656.4 | 889.5 | 935.0 | 954.1 |
Cash flow from operating activities | 587.0(2) | 655.7(3) | 482.3 | 828.9 | 925.7 |
Cash flow from investing activities | -422.7 | -897.7 | -350.9 | 87.2 | -361.1 |
Free cash flow(1) | 423.0(2) | 424.4(3) | 254.6(4) | 496.0(5) | 376.6(6) |
Cash flow from financing activities | -43.2 | 312.2 | -312.6 | -857.6 | -549.1 |
Cash and cash equivalents on December 31 | 101.7 | 238.5 | 58.1 | 117.6 | 131.3 |
(1) Free cash flow is defined as cash flow from operating activities, less capital expenditures, plus payments from disposals of intangible assets and property, plant and equipment
(2) 2016 without consideration of an income tax payment originally planned for the fourth quarter of 2015 (€ 100.0 million)
(3) 2017 without consideration of a capital gains tax refund originally planned for the fourth quarter of 2016 (€ 70.3 million)
(4) 2018 without tax payment from fiscal year 2016 (€ 34.7 million)
(5) 2019 without consideration of tax payments from fiscal year 2017 and previous years (€ -22.1 million); incl. the repayment portion of lease liabilities (€ 111.0 million), which have been reported under cash flow from financing activities since the fiscal year 2019 (IFRS 16)
(6) 2020 including the repayment portion of lease liabilities (€ 107.2 million), which have been reported under cash flow from financing activities since the fiscal year 2019 (IFRS 16)
Group’s asset position
The balance sheet total increased from € 9.129 billion as of December 31, 2019 to € 9.231 billion on December 31, 2020.
Development of current assets
in € million | Dec. 31, 2020 | Dec. 31, 2019 | Change |
Cash and cash equivalents | 131.3 | 117.6 | + 13.7 |
Trade accounts receivable | 344.8 | 346.0 | -1.2 |
Contract assets | 577.6 | 507.8 | + 69.8 |
Inventories | 85.4 | 79.3 | + 6.1 |
Prepaid expenses | 214.4 | 237.0 | -22.6 |
Other financial assets | 82.3 | 48.1 | + 34.2 |
Income tax claims | 64.8 | 21.5 | + 43.3 |
Other non-financial assets | 12.4 | 13.8 | -1.4 |
Total current assets | 1,512.9 | 1,371.2 | + 141.7 |
Current assets rose from € 1,371.2 million on December 31, 2019 to € 1,512.9 million on December 31, 2020. Cash and cash equivalents disclosed under current assets increased from € 117.6 million to €131.3 million. Due to customer growth, the item contract assets rose from € 507.8 million to € 577.6 million and includes current claims against customers due to accelerated revenue recognition from the application of IFRS 15. By contrast, current prepaid expenses fell from € 237.0 million to € 214.4 million, as a result of closing-date effects and the write-off of available VDSL contingents, and now mainly comprise the short-term portion of expenses relating to contract acquisition and contract fulfillment according to IFRS 15. Due to the reclassification of derivatives from non-current to current financial assets, other financial assets increased from € 48.1 million to € 82.3 million. Income tax claimsrose from € 21.5 million to € 64.8 million as a result of tax prepayments made and subsequent effects from tax audits. Trade accounts receivable, inventoriesand other non-financial assets were virtually unchanged.
Development of non-current assets
in € million | Dec. 31, 2020 | Dec. 31, 2019 | Change |
Shares in associated companies | 89.6 | 196.0 | -106.5 |
Other financial assets | 9.9 | 90.4 | -80.5 |
Property, plant and equipment | 1,271.6 | 1,160.6 | + 111.0 |
Intangible assets | 2,197.8 | 2,167.4 | + 30.4 |
Goodwill | 3,609.4 | 3,616.5 | -7.1 |
Trade accounts receivable | 54.0 | 57.7 | -3.7 |
Contract assets | 196.5 | 174.3 | + 22.3 |
Prepaid expenses | 144.8 | 284.3 | -139.5 |
Deferred tax assets | 20.4 | 10.4 | + 10.0 |
Total non-current assets | 7,594.0 | 7,757.6 | -163.6 |
Assets held for sale | 124.0 | 0.0 | + 124.0 |
Non-current assets fell from € 7,757.6 million as of December 31, 2019 to € 7,594.0 million on December 31, 2020. Due mainly to the reclassification of Tele Columbus shares pursuant to IFRS 5 as “assets held for sale”, shares in associated companies decreased from € 196.0 million to € 89.6 million. Details are provided in chapter 2.2 “Business development” under “Group investments”. Due mainly to the sale of Afilias shares and the reclassification of derivatives to current financial assets, non-current other financial assets fell from € 90.4 million to € 9.9 million. The increase in property, plant, and equipment from € 1,160.6 million to € 1,271.6 million was mainly the result of additions from new long-term leases and network infrastructure. Due in particular to the one-off payment in connection with the extension of the MBA MVNO agreement, intangible assets increased from € 2,167.4 million to € 2,197.8 million. The item contract assetsrose in line with customer growth from € 174.3 million to € 196.5 million and includes non-current claims against customers due to accelerated revenue recognition from the application of IFRS 15. Mainly as a result of the write-off of available VDSL contingents, non-current prepaid expenses decreased from € 284.3 million to € 144.8 million and now mainly include the long-term portion of expenses relating to contract acquisition and contract fulfillment, as well as prepayments in connection with long-term purchasing agreements. Goodwill and trade accounts receivable were largely unchanged.
Development of current liabilities
in € million | Dec. 31, 2020 | Dec. 31, 2019 | Change |
Trade accounts payable | 532.8 | 475.5 | + 57.3 |
Liabilities due to banks | 370.4 | 243.7 | + 126.7 |
Income tax liabilities | 114.6 | 91.7 | + 22.9 |
Contract liabilities | 152.1 | 149.9 | + 2.2 |
Other accrued liabilities | 9.3 | 18.4 | -9.1 |
Other financial liabilities | 278.6 | 239.4 | + 39.2 |
Other non-financial liabilities | 46.7 | 50.3 | -3.6 |
Total current liabilities | 1,504.6 | 1,269.0 | + 235.6 |
Current liabilities rose from € 1,269.0 million as of December 31, 2019 to € 1,504.6 million on December 31, 2020. Due to closing-date effects, current trade accounts payable increased from € 475.5 million to € 532.8 million. There was an increase in current bank liabilities from € 243.7 million to € 370.4 million following a reclassification of non-current liabilities (in accordance with their maturity). Effects from tax audits of previous years resulted in an increase in income tax liabilities from € 91.7 million to € 114.6 million. Due in particular to marketing activities, current other financial liabilities rose from € 239.4 million to € 278.6 million. The item current contract liabilities, which mainly includes payments received from customer contracts for which the performance has not yet been completely rendered, as well as the itemscurrent other accrued liabilities, and current other non-financial liabilities were all largely unchanged.
Development of non-current liabilities
in € million | Dec. 31, 2020 | Dec. 31, 2019 | Change |
Liabilities due to banks | 1,095.7 | 1,494.6 | -399.0 |
Deferred tax liabilities | 331.6 | 351.8 | -20.2 |
Trade accounts payable | 6.0 | 6.1 | -0.1 |
Contract liabilities | 33.6 | 34.9 | -1.3 |
Other accrued liabilities | 69.3 | 67.6 | + 1.7 |
Other financial liabilities | 1,278.7 | 1,289.9 | -11.2 |
Total non-current liabilities | 2,815.0 | 3,245.0 | -430.0 |
Non-current liabilities declined from € 3,245.0 million as of December 31, 2019 to € 2,815.0 million on December 31, 2020. This was mainly due to long-term bank liabilities, which were reduced significantly from € 1,494.6 million to € 1,095.7 million following the repayment of loans and reclassifications to current liabilities. Deferred tax liabilities decreased from € 351.8 million to € 331.6 million. Please refer to note 15 “Income taxes” for further details. Non-current other financial liabilities also fell slightly from € 1,289.9 million to € 1,278.7 million. Non-current trade accounts payable,non-current contract liabilities (which mainly include payments received from customer contracts for which the performance has not yet been completely rendered), and non-current other accrued liabilities were all largely unchanged.
Development of equity
in € million | Dec. 31, 2020 | Dec. 31, 2019 | Change |
Capital stock | 194.0 | 205.0 | -11.0 |
Capital reserves | 2,322.8 | 2,643.9 | -321.2 |
Accumulated profit | 2,240.5 | 1,993.9 | + 246.6 |
Treasury shares | -212.7 | -548.4 | + 335.7 |
Revaluation reserves | -4.4 | 25.2 | -29.5 |
Currency translation adjustment | -21.1 | -9.6 | -11.5 |
Equity attributable to shareholders of the parent company | 4,519.1 | 4,310.0 | + 209.1 |
Non-controlling interests | 392.1 | 304.8 | + 87.3 |
Total equity | 4,911.2 | 4,614.7 | + 296.5 |
The Group’s equity capital rose from € 4,614.7 million as of December 31, 2019 to € 4,911.2 million on December 31, 2020. The equity ratio increased accordingly from 50.6% to 53.2%.
Capital reserves decreased from € 2,643.9 million to € 2,322.8 million. The decline is mainly attributable to the cancelation of treasury shares. By contrast, the Group’s accumulated profit rose from € 1,993.9 million to € 2,240.5 million and contains the past profits of the consolidated companies, insofar as they were not distributed, less payments for share-based compensation.
Based on the authorization granted by the Annual Shareholders' Meeting on May 18, 2017 regarding the acquisition and use of treasury shares, and with the approval of the Supervisory Board, the Management Board of United Internet AG resolved on March 12, 2020 to cancel 11,000,000 treasury shares and to reduce the capital stock of United Internet AG by € 11,000,000, from € 205,000,000 to € 194,000,000. The number of shares issued decreased correspondingly by 11,000,000, from 205,000,000 to 194,000,000 shares. Issued shares continue to represent a notional share of capital stock of € 1 each. The cancelation of treasury shares is aimed at raising the percentage stake of United Internet shareholders. On completion of the capital reduction, the Company’s capital stock therefore returned to the level prior to the capital increase for the Versatel acquisition in 2014. Following the cancelation of these 11,000,000 shares, United Internet still holds 6,338,513 treasury shares – compared to 17,338,513 as of December 31, 2019. With the approval of the Supervisory Board, the Management Board of United Internet AG resolved on April 1, 2020 to launch a new share buyback program. In the course of this share buyback program up to 5,000,000 shares of the Company (corresponding to approx. 2.58% of the capital stock of € 194,000,000) were to be bought back via the stock exchange. The Company thus also utilized the authorization issued by the Annual Shareholders’ Meeting of May 18, 2017. The volume of the share buyback program amounted to € 150 million in total. The program was launched on April 3, 2020 and was to last until August 31, 2020 at the latest. On April 30, 2020, the Management Board of United Internet AG resolved to suspend this share buyback program with effect as of the end of the trading day (April 30, 2020). United Internet AG reserved the right to resume or cancel the share buyback program at any time. In the course of this share buyback program, the Company bought back 430,624 treasury shares for a total of € 12.2 million and thus held a total of 6,769,137 treasury shares (approx. 3.49% of capital stock) as of April 30, 2020, the date on which the program was suspended, and also at the end of the reporting period on December 31, 2020.
Despite the dividend payment of € 93.6 million and the contractually agreed payment of € 165.0 million to Telefónica Germany in the third quarter of 2020 for the first five-year extension phase of the MBA MVNO agreement beginning on July 1, 2020, the Group’s net bank liabilities (i.e., the balance of bank liabilities and cash and cash equivalents) were reduced from € 1,620.8 million as of December 31, 2019 to € 1,334.8 million on December 31, 2020.
Multi-period overview: development of relative indebtedness
Dec. 31, 2016 | Dec. 31, 2017 | Dec. 31, 2018 | Dec. 31, 2019 | Dec. 31, 2020 | |
Net bank liabilities(1) / | 1.98 | 1.37 | 1.57 | 1.28 | 1.27 |
Net bank liabilities(1) / | 3.88 | 4.04 | 7.39 | 3.27 | 3.54 |
(1) Net bank liabilities = balance of bank liabilities and cash and cash equivalents
(2) Free cash flow without consideration of an income tax payment originally due in the fourth quarter of 2015 of around € 100.0 million (2016), a capital gains tax refund originally planned for the fourth quarter of 2016 of € 70.3 million (2017), a tax payment from fiscal year 2016 of € 34.7 million (2018) and tax payments from fiscal year 2017 and previous years of € -22.1 million (2019); Free cash flow 2019 and 2020 incl. the repayment portion of lease liabilities of € 111.0 million and € 107.2 million respectively, which have been reported under cash flow from financing activities since the financial year 2019 (IFRS 16)
Further details on the objectives and methods of the Group’s financial risk management are provided under note 43 of the Notes to the Consolidated Financial Statements.
Multi-period overview: development of key balance sheet items
in € million | Dec. 31, 2016 | Dec. 31, 2017 | Dec. 31, 2018 | Dec. 31, 2019 | Dec. 31, 2020 | ||||
Total assets | 4,073.7 | 7,605.2 | 8,173.8 | 9,128.8 | 9,230.8 | ||||
Cash and cash equivalents | 101.7 | 238.5 | 58.1 | 117.6 | 131.3 | ||||
Shares in associated companies | 755.5 | 418.0(1) | 206.9(1) | 196.0 | 89.6 | ||||
Other financial assets | 287.7 | 333.7(2) | 348.1(2) | 90.4(2) | 9.9(2) | ||||
Property, plant and equipment | 655.0 | 747.4(3) | 818.0 | 1,160.6(3) | 1,271.6 | ||||
Intangible assets | 369.5 | 1,408.4(3) | 1,244.6 | 2,167.4(4) | 2,197.8 | ||||
Goodwill | 1,087.7 | 3,564.1(5) | 3,612.6(5) | 3,616.5 | 3,609.4 | ||||
Liabilities due to banks | 1,760.7 | 1,955.8(6) | 1,939.1 | 1,738.4 | 1,466.1 | ||||
Capital stock | 205.0 | 205.0 | 205.0 | 205.0 | 194.0(7) | ||||
Equity | 1,197.8 | 4,048.7(8) | 4,521.5(8) | 4,614.7 | 4,911.2 | ||||
Equity ratio | 29.4% | 53.2% | 55.3% | 50.6% | 53.2% | ||||
(1) Decrease due to takeover and consolidation of ProfitBricks and Drillisch (2017); decrease due to Tele Columbus impairment charges (2018)
(2) Increase due to subsequent valuation of shares in listed companies (2017); increase due to subsequent valuation of shares in listed companies (2018); decrease due to sale of Rocket Internet shares (2019)
(3) Increase due to Strato, ProfitBricks and Drillisch takeovers (2017); increase due to initial application of IFRS 16 (2019)
(4) Increase due to initial recognition of acquired 5G frequencies (2019)
(5) Increase due to Strato, ProfitBricks and Drillisch takeovers (2017); increase due to World4You takeover (2018)
(6) Increase due to Strato takeover and increased stakes in Drillisch and Tele Columbus (2017)
(7) Decrease due to withdrawal of treasury shares
(8) Increase due to consolidation effects in connection with the investment of Warburg Pincus in the Business Applications segment and takeover of Strato (2017); transitional effects from initial application of IFRS 15 (2018)
Management Board’s overall assessment of the Group’s business situation
Against the backdrop of the coronavirus pandemic, the economies of all target countries of the United Internet Group, as well as the global economy as a whole, suffered a sharp decline in economic output in fiscal 2020.
United Internet’s most important market, Germany, suffered a decline in gross domestic product of -5.4% according to the Federal Statistical Office – following a plus of +0.6% in the previous year. The German ICT market also lagged behind the previous year at -0.6%.
Despite its stable and largely non-cyclical business model, United Internet’s business activities in the fiscal year 2020 were also affected by the economic impact of the coronavirus pandemic – albeit to a much lesser extent than other sectors and companies.
Nevertheless, United Internet was able to achieve the targets it set itself and made further progress with organic growth in customer contracts of 910,000 to 25.65 million and sales growth of 3.3% (despite negative pandemic effects) to € 5.367 billion. Earnings were impacted by negative special items from the one-off, non-cash write-off of remaining VDSL contingents. Adjusted for this special item and special items in the previous year, operating EBITDA was 5.3 percent down on the previous year at € 1.179 billion. Additionally adjusted for the retroactive price reduction in wholesale mobile communication services (on conclusion of the national roaming agreement to be recognized out-of-period in fiscal 2021), the impact on earnings of the coronavirus pandemic and regulatory effects, initial costs for the Group’s own 5G network, and integration costs, like-for-like EBITDA increased year-on-year by 1.3%.
This positive performance – especially in view of the economic recession and negative sector trends – highlights the benefits of United Internet’s business model based predominantly on electronic subscriptions with fixed monthly payments and contractually fixed terms. This ensures stable and predictable revenues and cash flows, offers protection against cyclical influences and provides the financial scope to win new customers, expand existing customer relationships, and grasp opportunities in new business fields and new markets – organically or via investments and acquisitions.
In the fiscal year 2020, the Company once again invested heavily in gaining and expanding customer relationships, as well as in developing new products – thus laying the basis for future growth.
The financial position of United Internet AG remained strong in fiscal 2020. Despite the one-off payment of € 165 million for the extension phase of the MBA MVNO agreement in the fiscal year 2020, free cash flow remained high at € 483.8 million or € 376.6 million after leasing (like-for-like prior-year figure: € 607.0 million or € 496.0 million after leasing). This once again underlines the Group’s ability to generate very healthy levels of cash while at the same time achieving stable and qualitative growth. Against this backdrop, the Company plans to finance the development of its own mobile communications network largely from current revenue.
As of the reporting date for the Annual Financial Statements 2020, and at the time of preparing this Management Report, the Management Board believes that the United Internet Group as a whole is well placed for its further development. It regards the financial position and performance – subject to possible special items – as positive and is optimistic about the Group’s future prospects.