

2.2 Business development
Use and definition of relevant financial performance measures
In order to ensure the clear and transparent presentation of United Internet’s business trend, the Group’s Annual Financial Statements and Interim Financial Statements include key financial performance measures – in addition to the disclosures required by International Financial Reporting Standards (IFRS) – such as EBITDA, the EBITDA margin, EBIT, the EBIT margin, and free cash flow.
United Internet defines these measures as follows:
- EBIT: Earnings before interest and taxes represents the operating result disclosed in the statement of comprehensive income.
- EBIT margin: Presents the ratio of EBIT to sales.
- EBITDA: Earnings before interest, taxes, depreciation, and amortization are calculated as EBIT/operating result plus the depreciation and amortization (disclosed in the Consolidated Financial Statements) of intangible assets and property, plant, and equipment, as well as assets capitalized in the course of company acquisitions.
- EBITDA margin: Presents the ratio of EBITDA to sales.
- Free cash flow: Calculated as cash flow from operating activities (disclosed in the consolidated financial statement), less capital expenditure for intangible assets and property, plant, and equipment, plus payments from the disposal of intangible assets and property, plant, and equipment.
Insofar as necessary for a clear and transparent presentation, these indicators are adjusted for special items. Such special items usually refer solely to those effects capable of restricting the validity of the key financial performance measures with regard to the Group’s financial and earnings performance – due to their nature, frequency, and/or magnitude. All special items are presented and explained for the purpose of reconciliation with the unadjusted financial figures in the relevant section of the financial statements.
One-off amounts (such as one-offs for integration projects) or other effects (e.g., from regulation topics or the coronavirus pandemic) in the fiscal years 2019 and 2020 were not adjusted but are disclosed in the respective sections.
Currency-adjusted sales and earnings figures are calculated by converting sales and earnings figures with the average exchange rates of the comparative period, instead of the current period.
Actual and forecast development 2020
United Internet AG maintained its growth trajectory in the fiscal year 2020 and reached its forecast of September (EBITDA) and November 2020 (sales).
Forecast development
United Internet published its guidance for the fiscal year 2020 in its Annual Financial Statements 2019 and specified or adjusted them during 2020 as follows:
Actual | Forecast 2020 | Specification | Adjustment | Specification | |
Sales | € 5.194 billion | Prior-year level | approx. + 4% | approx. + 4% | approx. + 3% |
EBITDA | € 1.266 billion | Prior-year level | Prior-year level | € 1.180 billion | € 1.180 billion |
(1) Against the backdrop of uncertain macroeconomic conditions due to the continued spread of the coronavirus, United Internet AG expected sales and EBITDA for the fiscal year 2020 to be approximately on a par with the previous year
(2) Against the backdrop of business development in 2020 up to this date, United Internet AG updated its full-year sales guidance
(3) Against the backdrop of a significant price increase for 1&1 Drillisch’s use of Telefónica’s network capacities as of July 2020, United Internet AG downgraded its full-year EBITDA guidance as a precautionary measure
(4) Against the backdrop of a reduced willingness among existing customers of 1&1 Drillisch to change tariffs and the resulting lower sales of smartphones and tablets, United Internet AG updated its full-year sales guidance
Actual development
In the fiscal year 2020, consolidated sales roseby 3.3%, from € 5.194 billion in the previous year to € 5.367 billion and were thus slightly above the last forecast (approx. + 3%), or € 173 million and thus 3.3% above the original forecast (March guidance).
Without consideration of a one-off, non-cash special item of € 129.9 million from the write-off of still available VDSL contingents, operational consolidated EBITDA for the fiscal year 2020 amounted to € 1.179 billion (acc. to IFRS 16) and was thus within the anticipated target range of the last forecast (approx. € 1.180 billion), or € 87 million and thus 6.9% below the original forecast (March guidance).
Summary: actual and forecast development of business in 2020
Actual | Forecast 2020 | Actual | |
Sales | € 5.194 billion | approx. + 3% | + 3.3% |
EBITDA (operating) | € 1.244 billion | € 1.180 billion | € 1.179 billion |
Further information on the above mentioned special item is provided in chapter 2 “Economic report” under “Legal conditions / significant events”.
Development of divisions and segments
The Group’s operating activities are divided into the two business divisions Access and Applications, which in turn are divided into the segments Consumer Access and Business Access, as well as Consumer Applications and Business Applications.
Details on the business models of the individual segments are presented in chapter 1.1 “Business model”.
Consumer Access segment
In addition to preparations for the establishment of its own mobile communications network, the Consumer Access segment once again focused on adding further valuable broadband and mobile internet contracts in the fiscal year 2020. The total number of fee-based contracts in the Consumer Access segment rose by 500,000 contracts to 14.83 million in 2020. Broadband connections decreased slightly by 30,000 to 4.31 million, while mobile internet contracts increased by 530,000 to 10.52 million.
Development of Consumer Access contracts in the fiscal year 2020
in million | Dec. 31, 2020 | Dec. 31, 2019 | Change |
Consumer Access, total contracts | 14.83 | 14.33 | + 0.50 |
thereof Mobile Internet | 10.52 | 9.99 | + 0.53 |
thereof broadband connections | 4.31 | 4.34 | -0.03 |
Development of Consumer Access contracts in the fourth quarter of 2020
in million | Dec. 31, 2020 | Sept. 30, 2020 | Change |
Consumer Access, total contracts | 14.83 | 14.68 | + 0.15 |
thereof Mobile Internet | 10.52 | 10.36 | + 0.16 |
thereof broadband connections | 4.31 | 4.32 | -0.01 |
Sales of the Consumer Access segment roseby3.1% in 2020, from € 3,647.5 million in the previous year to € 3,759.0 million. Whereas the temporary change in customer behavior caused by the coronavirus pandemic (especially in the field of telephony, due in part to work-from-home regulations and shelter-in-place restrictions) still had a positive impact on sales in the first quarter of 2020, this was outweighed in the second and third quarters by burdens on sales (especially from reduced international roaming revenue) due to severely restricted travel possibilities for customers in this segment. All in all, there was a resulting negative effect on sales of € -24.1 million. Adjusted for this effect, like-for-like sales rose by 3.7%.
Despite the fall in international roaming revenue, high-margin service revenues – which represent the core business of this segment – rose by 2.6% from € 2,943.0 million to € 3,020.0 million. Low-margin hardware sales (customers pay no or only a low one-off price when signing contracts and the device is refinanced via higher tariff prices over the contract term) increased by 4.9% from € 704.5 million to € 739.0 million – even though the third and fourth quarters were well below target due to fewer tariff changes among existing customers.
In fiscal year 2020, segment earnings were burdened by a one-off, non-cash write-off of € 129.9 million for existing VDSL contingents. Details are provided in chapter 2 “Economic report” under “Legal conditions / significant events”.
Even without consideration of this special item, segment EBITDA of € 601.2 million fell short of the prior-year figure (€ 686.6 million). This was mainly due to a price increase introduced by Telefónica on July 1, 2020 for the use of its network capacity. Details are provided in chapter 2 “Economic report” under “Legal conditions / significant events”.
In addition to this price rise, which will be reduced retroactively by € 34.4 million on conclusion of the national roaming agreement (out-of-period recognition in fiscal 2021), earnings were burdened by negative effects from regulatory decisions of the EU on SMS tariffs (since May 15, 2019) and of Germany’s Federal Network Agency regarding subscriber line charges (since July 1, 2019) with a total impact of € -13.7 million. Moreover, the initial costs for the construction of the Company’s own 5G mobile communications network rose to € -13.9 million (prior year: € -5.7 million). By contrast, one-off costs for integration projects declined to € -1.1 million (prior year: € -3.2 million). On top of this, the temporary change in customer behavior caused by the coronavirus pandemic in the fiscal year 2020 (especially for telephony and international roaming due in part to work-from-home regulations, shelter-in-place restrictions, and greatly reduced travel) also burdened segment earnings by € -25.2 million (compared to 2020 planning). Adjusted for the one-off, non-cash write-off and the aforementioned effects, like-for-like EBITDA amounted to € 689.5 million (prior year: € 695.5 million).
Due to the above mentioned burdens on earnings, segment EBIT of € 448.7 million (without consideration of the special item) was also down on the prior-year figure (€ 536.1 million).
The number of employees in this segment rose by 0.9% to 3,191 in 2020 (prior year: 3,163).
Key sales and earnings figures in the Consumer Access segment (in € million)
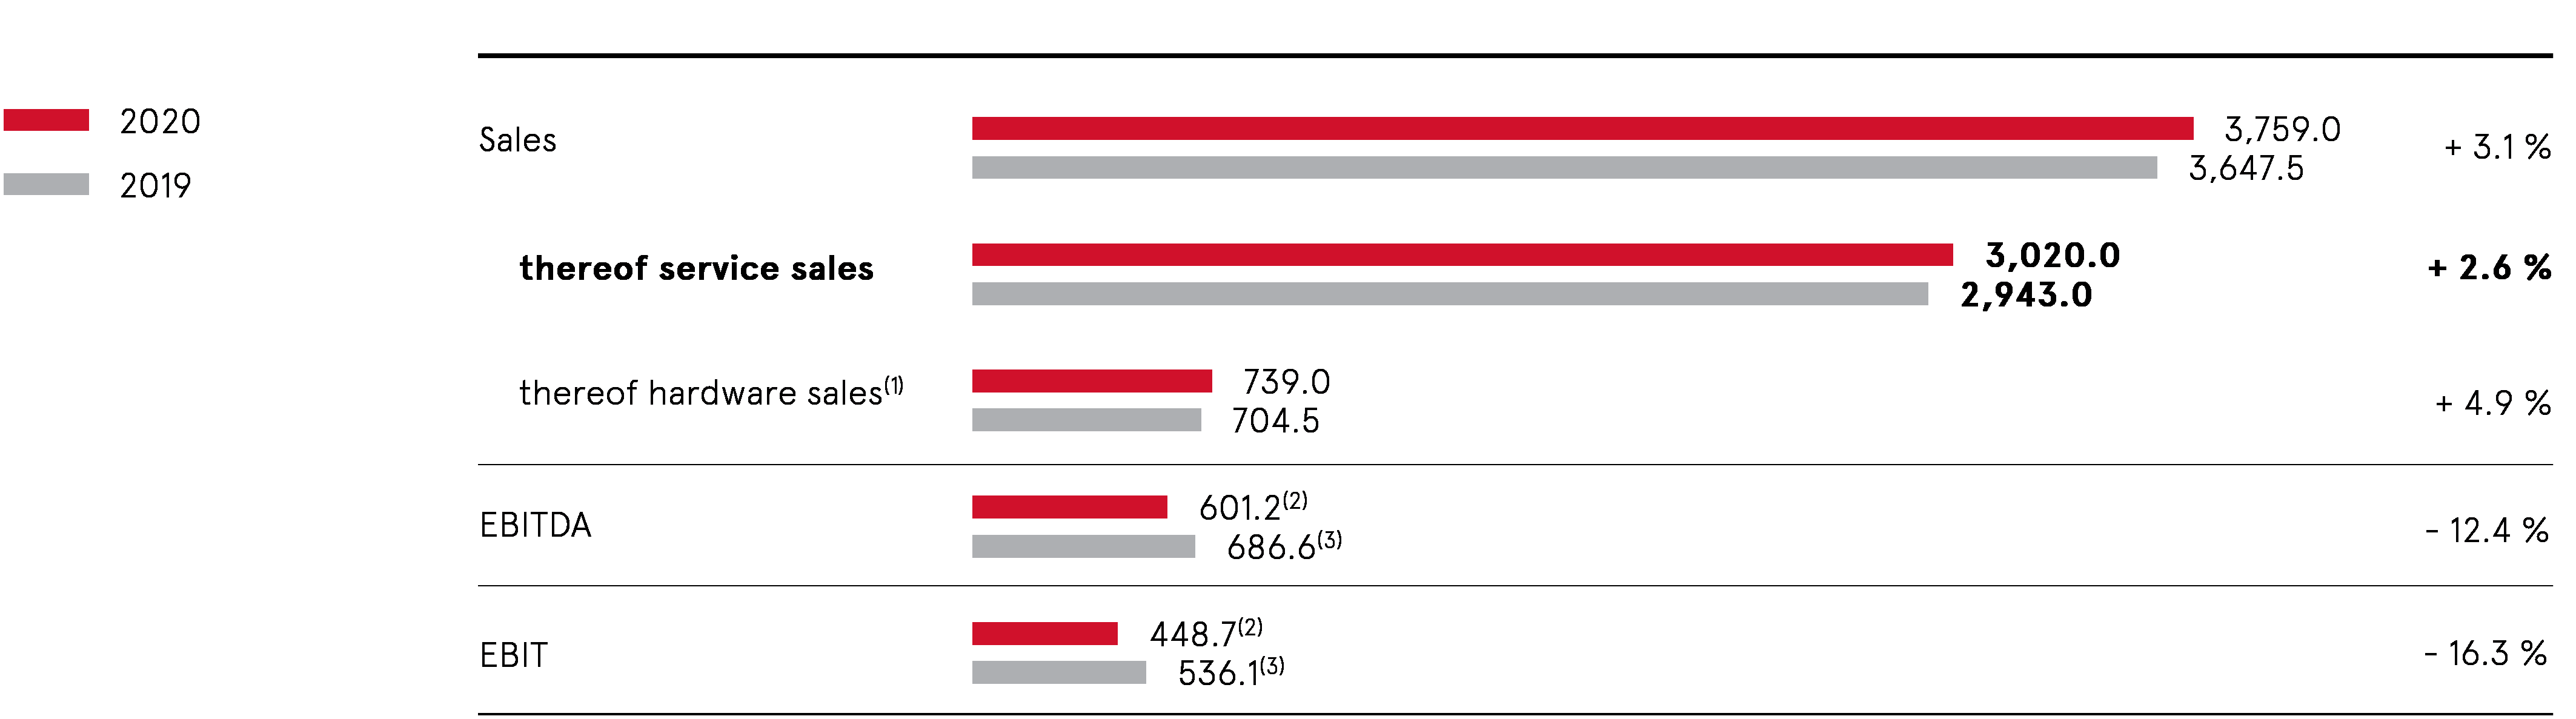
(1) Hardware sales incl. small amount of other sales
(2) Including one-off expenses for integration projects (EBITDA and EBIT effect: € -1.1 million); excluding write-off of VDSL contingents that are still available (EBITDA and EBIT effect: € -129.9 million)
(3) Including one-off expenses for integration projects (EBITDA and EBIT effect: € -3.2 million)
Quarterly development; change over prior-year quarter
in € million | Q1 2020 | Q2 2020 | Q3 2020 | Q4 2020 | Q4 2019 | Change |
Sales | 933.7 | 933.5 | 925.6 | 966.2 | 938.3 | + 3.0% |
thereof service sales | 747.8 | 749.1 | 760.8 | 762.3 | 742.7 | + 2.6% |
thereof hardware sales(1) | 185.9 | 184.4 | 164.8 | 203.9 | 195.6 | + 4.2% |
EBITDA | 164.8(2) | 166.5(3) | 127.3(4) | 142.6(5) | 178.0(6) | -19.9% |
EBIT | 128.2(2) | 129.7(3) | 87.8(4) | 103.0(5) | 139.4(6) | -26.1% |
(1) Hardware sales incl. small amount of other sales
(2) Including one-off expenses for integration projects (EBITDA and EBIT effect: € -0.3 million)
(3) Including one-off expenses for integration projects (EBITDA and EBIT effect: € -0.1 million)
(4) Including one-off expenses for integration projects (EBITDA and EBIT effect: € -0.3 million)
(5) Including one-off expenses for integration projects (EBITDA and EBIT effect: € -0.4 million); excluding write-off of VDSL contingents that are still available (EBITDA and EBIT effect: € -129.9 million)
(6) Including one-off expenses for integration projects (EBITDA and EBIT effect: € +0.6 million from reversal of provisions)
Multi-period overview: Development of key sales and earnings figures
in € million | 2016 | 2017 | 2018 | 2019 | 2020 |
Sales | 2,414.0 | 2,781.6 | 3,600.8 | 3,647.5 | 3,759.0 |
thereof service sales | 2,317.9 | 2,631.0 | 2,854.4 | 2,943.0 | 3,020.0 |
thereof hardware sales(1) | 96.1 | 150.6 | 746.4 | 704.5 | 739.0 |
EBITDA | 395.2 | 541.2(2) | 719.3(3) | 686.6(4) | 601.2(5) |
EBITDA margin | 16.4% | 19.5% | 20.0% | 18.8% | 16.0% |
EBIT | 384.5 | 471.4(2) | 560.6(3) | 536.1(4) | 448.7(5) |
EBIT margin | 15.9% | 16.9% | 15.6% | 14.7% | 11.9% |
(1) Hardware sales incl. small amount of other sales
(2) Without extraordinary income from revaluation of Drillisch shares (EBITDA and EBIT effect: € +303.0 million) and without restructuring charges in offline sales (EBITDA and EBIT effect: € -28.3 million)
(3) Including one-off expenses for integration projects (EBITDA and EBIT effect: € -25.1 million)
(4) Including one-off expenses for integration projects (EBITDA and EBIT effect: € -3.2 million)
(5) Including one-off expenses for integration projects (EBITDA and EBIT effect: € -1.1 million); excluding write-off of VDSL contingents that are still available (EBITDA and EBIT effect: € -129.9 million)
Business Access segment
Despite the expiry in the previous year of services which 1&1 Versatel had previously provided for the broadband customers of 1&1 Drillisch, acquired in 2017, sales and earnings in the Business Access segment were improved in the fiscal year 2020.
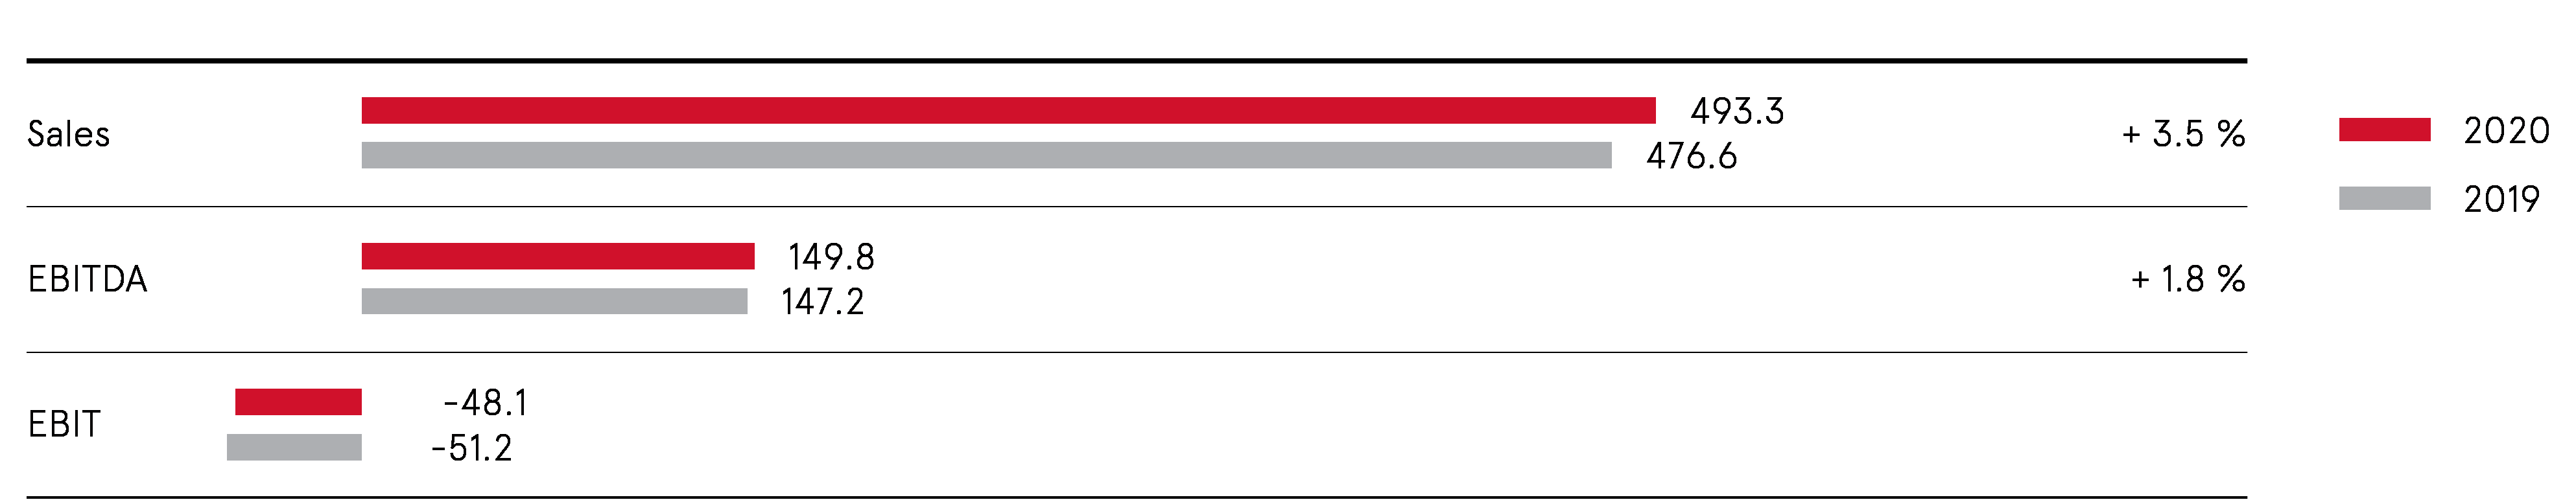
Segment sales in the fiscal year 2020 rose by 3.5% from € 476.6 million to € 493.3 million. There was an increase in segment EBITDA of 1.8% from € 147.2 million to € 149.8 million. These figures include positive effects from increased telephony (voice) business as a result of the coronavirus pandemic, which led to an additional € +3.8 million in sales and € +1.6 million in EBITDA.
Without consideration of the aforementioned services provided in the previous year, like-for-like sales rose by 6.5% and like-for-like EBITDA by 5.3% or – additionally adjusted for the above mentioned positive pandemic effect – by 5.7% (sales) and 4.2% (EBITDA).
In addition to services for 1&1 Drillisch that expired at the end of 2019, sales and earnings contributions in the fourth quarter of 2020 from project business (one-off payments), which have now been almost completely scaled back (compared with the strong prior-year quarter), as well as one-off effects on earnings (structural costs, technical relocations, network conversions and upgrades) prevented an even better development of sales and EBITDA in the fiscal year 2020.
Despite high writedowns for network infrastructure, segment EBIT improved to € -48.1 million, compared to € -51.2 million in the previous year.
The number of employees in this segment rose by 0.3% to 1,188 in 2020 (prior year: 1,184).
Key sales and earnings figures in the Business Access segment
Quarterly development; change over prior-year quarter
in € million | Q1 2020 | Q2 2020 | Q3 2020 | Q4 2020 | Q4 2019 | Change |
Sales | 118.7 | 122.8 | 125.1 | 126.7 | 124.1 | + 2.1% |
EBITDA | 35.2 | 39.7 | 39.4 | 35.5 | 42.2 | -15.9% |
EBIT | -14.5 | -10.7 | -9.4 | -13.5 | -8.2 | |
Multi-period overview: Development of key sales and earnings figures
in € million | 2016 | 2017 | 2018 | 2019 | 2020 |
Sales | 513.7 | 447.9 | 465.9 | 476.6 | 493.3 |
EBITDA | 124.0 | 81.5 | 72.6 | 147.2 | 149.8 |
EBITDA margin | 24.1% | 18.2% | 15.6% | 30.9% | 30.4% |
EBIT | -1.0 | -40.2 | -58.1 | -51.2 | -48.1 |
EBIT margin | - | - | - | - | - |
Consumer Applications segment
In the Consumer Applications segment, the number of fee-based pay accounts (contracts)rose by 110,000 to 2.37 million in the fiscal year 2020. Ad-financed free accounts increased by 1.81 million to 39.40 million. The total number of Consumer Applications accounts therefore increased by 1.92 million to 41.77 million.
Development of Consumer Applications accounts in the fiscal year 2020
in million | Dec. 31, 2020 | Dec. 31, 2019 | Change |
Consumer Applications, total accounts | 41.77 | 39.85 | + 1.92 |
thereof with Premium Mail subscription | 1.63 | 1.54 | + 0.09 |
thereof with Value-Added subscription | 0.74 | 0.72 | + 0.02 |
thereof free accounts | 39.40 | 37.59 | + 1.81 |
Development of Consumer Applications accounts in the fourth quarter of 2020
in million | Dec. 31, 2020 | Sept. 30, 2020 | Change |
Consumer Applications, total accounts | 41.77 | 41.17 | + 0.60 |
thereof with Premium Mail subscription | 1.63 | 1.61 | + 0.02 |
thereof with Value-Added subscription | 0.74 | 0.74 | 0.00 |
thereof free accounts | 39.40 | 38.82 | + 0.58 |
In 2020, operations in the Consumer Applications segment continued to focus on the repositioning and reconstruction of the GMX and WEB.DE portals, as well as the simultaneous establishment of data-driven business models. In addition to the further increase in customer accounts, this transformation is already being reflected in initial successes in the segment’s key financial figures – although these were overshadowed, especially in the second quarter and to some extent in the third quarter of 2020, by a decline in the online advertising market due to the marked restraint of many advertisers during the coronavirus pandemic. The loss of marketing business caused by the pandemic impacted sales by € -4.8 million and earnings by € -3.6 million in total during fiscal year 2020.
All in all, sales of the Consumer Applications segment improved by 1.9% from € 247.2 million (€ 255.0 million reported prior-year figure) to € 251.8 million. It should be noted that for this key figure, third-party marketing revenues were changed from gross to net presentation at the beginning of 2020. This change was necessitated by the altered contractual terms of newly concluded agreements with third-party marketing partners. A comparison of segment revenue on a net basis and after adjustment of the above mentioned pandemic-related negative sales effect (€ -4.8 million) reveals an increase in total like-for-like sales of 3.8%.
Sales in the segment’s core business of pay accounts and the marketing of ad space on its own portals improved by 2.1% from € 242.2 million to € 247.3 million. Adjusted for the pandemic-related sales effect, like-for-like sales in the segment’s core business rose by 4.1%.
Sales in the field of third-party marketing amounted to € 4.5 million net – compared to a net amount of € 5.0 million in the previous year.
Segment EBITDA of € 100.7 million was not affected by the change to net disclosure but was slightly below the prior-year figure (€ 103.6 million) due to the above mentioned pandemic-related negative effects on earnings (€ -3.6 million). Adjusted for this effect, like-for-like EBITDA improved by 0.7% in the fiscal year 2020, whereby the second half of 2020 was affected by changes in the mix of advertising formats and environments requested by advertisers.
Due in particular to increased depreciation and amortization, as well as the negative impact of the coronavirus pandemic, segment EBIT of € 79.0 million was also down on the previous year (€ 85.9 million).
The number of employees in this segment fell slightly by 0.2% to 1,005 in 2020 (prior year: 1,007).
Key sales and earnings figures in the Consumer Applications segment (in € million)

(1) Sales in 2019 after changing from gross to net presentation of third-party marketing revenues in 2020; the gross amount disclosed in 2019 is shown in brackets;
Quarterly development; change over prior-year quarter
in € million | Q1 2020 | Q2 2020 | Q3 2020 | Q4 2020 | Q4 2019 | Change |
Sales(1) | 60.8 | 58.9 | 61.2 | 70.9 | 69.1 (70.6) | + 2.6% |
thereof pay accounts/portal marketing | 59.7 | 57.8 | 60.1 | 69.7 | 67.9 | + 2.7% |
thereof third-party marketing | 1.1 | 1.1 | 1.1 | 1.2 | 1.2 (2.7) | 0.0% |
EBITDA | 23.3 | 23.7 | 22.5 | 31.2 | 33.1 | -5.7% |
EBIT | 18.4 | 18.6 | 17.4 | 24.6 | 27.7 | -11.2% |
(1) Sales in the quarters of the previous year after changing from gross to net presentation of third-party marketing revenues in 2020; the gross amount disclosed in 2019 is shown in brackets
Multi-period overview: Development of key sales and earnings figures
in € million | 2016 | 2017 | 2018 | 2019 | 2020 |
Sales(1) | 283.6 | 284.2 | 274.2 | 247.2 (255.0) | 251.8 |
thereof pay accounts/portal marketing | 269.3 | 264.6 | 250.6 | 242.2 | 247.3 |
thereof third-party marketing | 14.3 | 19.6 | 23.6 | 5.0 (12.8) | 4.5 |
EBITDA | 127.6 | 124.0 | 112.8 | 103.6 | 100.7 |
EBITDA margin | 45.0% | 43.6% | 41.1% | 41.9% | 40.0% |
EBIT | 115.0 | 112.1 | 100.8 | 85.9 | 79.0 |
EBIT margin | 40.6% | 39.4% | 36.8% | 34.7% | 31.4% |
(1) Sales in 2019 after changing from gross to net presentation of third-party marketing revenues in 2020; the gross amount disclosed in 2019 is shown in brackets; 2016 - 2018 reported unchanged on a gross statement
Business Applications segment
Due in part to time-limited discounted offers for new customers during the coronavirus crisis, the number of fee-based Business Applications contracts was increased by 300,000 contracts in the fiscal year 2020. This growth resulted from 160,000 new contracts in Germany and 140,000 abroad. As a result, the total number of contracts rose to 8.45 million.
Development of Business Applications contracts in the fiscal year 2020
in million | Dec. 31, 2020 | Dec. 31, 2019 | Change |
Business Applications, total contracts | 8.45 | 8.15 | + 0.30 |
thereof in Germany | 4.06 | 3.90 | + 0.16 |
thereof abroad | 4.39 | 4.25 | + 0.14 |
Development of Business Applications contracts in the fourth quarter of 2020
in million | Dec. 31, 2020 | Sept. 30, 2020 | Change |
Business Applications, total contracts | 8.45 | 8.38 | + 0.07 |
thereof in Germany | 4.06 | 4.01 | + 0.05 |
thereof abroad | 4.39 | 4.37 | + 0.02 |
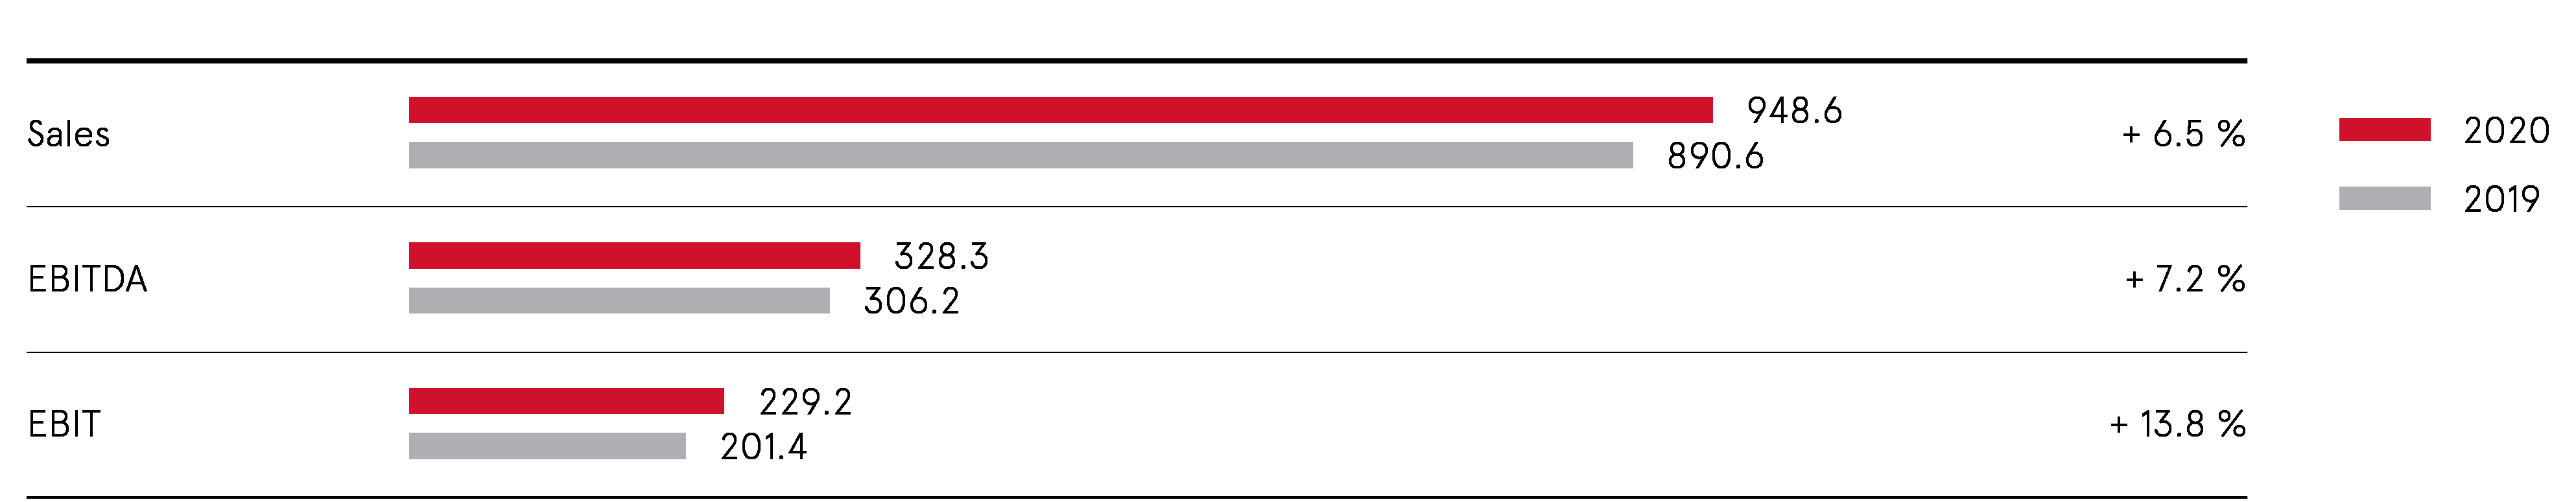
Sales of the Business Applications segment rose by 6.5% from € 890.6 million in the previous year to € 948.6 million in the fiscal year 2020. This increase in revenue was attributable in part to the lower-margin and volatile domain parking business of the Sedo brand, which grew more strongly than in the weak previous year and accounted for 3.1 percentage points of this growth.
Segment EBITDA improved by 7.2% from € 306.2 million to € 328.3 million. Segment EBITDA contains marketing expenses of € 90.2 million (prior year: € 97.0 million, of which € 19.2 million for rebranding), which amounted to € 27.0 million in the fourth quarter of 2020 (prior year: € 26.2 million; Q3 2020: € 15.1 million).
Due to lower depreciation and amortization charges, as well as the lack of rebranding measures, segment EBIT rose by 13.8% from € 201.4 million (excluding trademark writeups of Strato in the previous year amounting to € 19.4 million) to € 229.2 million.
The number of employees in this segment rose by 6.3% to 3,631 in 2020 (prior year: 3,416).
Key sales and earnings figures in the Business Applications segment (in € million)
(1) Excluding trademark writeups Strato (EBIT effect: € +19.4 million)
Quarterly development; change over prior-year quarter
in € million | Q1 2020 | Q2 2020 | Q3 2020 | Q4 2020 | Q4 2019 | Change |
Sales | 237.0 | 234.6 | 235.7 | 241.3 | 224.9 | + 7.3% |
EBITDA | 76.9 | 90.9 | 86.8 | 73.7 | 69.4 | + 6.2% |
EBIT | 51.6 | 65.8 | 61.6 | 50.2 | 44.6(1) | + 12.6% |
(1) Excluding trademark writeups Strato (EBIT effect: € +19.4 million)
Multi-period overview: Development of key sales and earnings figures
in € million | 2016 | 2017 | 2018 | 2019 | 2020 |
Sales | 638.9 | 762.1 | 841.8 | 890.6 | 948.6 |
EBITDA | 202.5 | 247.3 | 290.4 | 306.2 | 328.3 |
EBITDA margin | 31.7% | 32.4% | 34.5% | 34.4% | 34.6% |
EBIT | 159.2 | 175.4 | 202.1 | 201.4(1) | 229.2 |
EBIT margin | 24.9% | 23.0% | 24.0% | 22.6% | 24.2% |
(1) Excluding trademark writeups Strato (EBIT effect: € +19.4 million)
Group investments
United Internet continued to optimize its investment portfolio in the fiscal year 2020.
In the course of these optimization measures, shares in ePages GmbH were sold. In addition, United Internet committed in principle (subject to various conditions) to contribute its shares in the listed company Tele Columbus AG to a bidding company controlled by Morgan Stanley Infrastructure Partners and to support the implementation of the Fiber Champion strategy of Tele Columbus.
Significant changes in investments
Sale of shares in ePages
In the third quarter of 2020, United Internet sold its shares in ePages GmbH (share of voting rights as of December 31, 2019: 25.01%) as the company no longer played a role in the strategic investment portfolio. The sale resulted in income of € 0.5 million.
In addition to its (fully consolidated) core operating companies, United Internet also held investments in the following companies as of December 31, 2020.
Minority holdings in listed companies
In February 2016, United Internet announced its investment in Tele Columbus AG. As of December 31, 2020, the share of voting rights amounted to 29.90% (prior year: 29.90%). The company’s market capitalization as of December 31, 2020 was around € 409 million in total (prior year: € 357 million).
As an anchor investor in Tele Columbus AG, United Internet AG announced on December 21, 2020 that, together with Morgan Stanley Infrastructure Partners, it would provide sustained support for the implementation of Tele Columbus’s Fiber Champion strategy. With this strategy, Tele Columbus plans to play a major role in driving the expansion of Germany’s fiber optic infrastructure. At present, 2.4 million households are connected to the broadband network of Tele Columbus; by 2030, around 2.0 million of these households are to be supplied with gigabit bandwidths via optical fiber.
To this end, Tele Columbus AG has gained Morgan Stanley Infrastructure Partners as an infrastructure investor with a long-term perspective. UNA 422. Equity Management GmbH, a bidding company which will trade in future as Kublai GmbH and behind which is Morgan Stanley Infrastructure Partners, announced a voluntary public takeover offer of € 3.25 per Tele Columbus share on December 21, 2020.
If the takeover offer is successful, United Internet will contribute its stake in Tele Columbus of around 29.90% to the bidding company. In return, United Internet will receive a shareholding in the bidding company. In addition, the bidding company has committed to subscribe for new shares worth up to € 475 million in the event of a rights issue to be adopted by Tele Columbus. On conclusion of the takeover offer, United Internet will participate in the capital increase with an amount in the range of € 142 million to € 190 million. Following successful completion of the transaction, United Internet can increase its stake in the bidding company at its own discretion so that it has an indirect long-term shareholding in Tele Columbus of between 29.9% and 40%, provided that Kublai GmbH holds a 100% stake in Tele Columbus AG.
Moreover, the bidding company announced that it was prepared to provide further equity of up to € 75 million in the future for the implementation of the Fiber Champion strategy. United Internet will also participate on a pro rata basis.
Part of Tele Columbus’s Fiber Champion strategy is also to open up its broadband network for cooperation partners. In the wake of this move, 1&1 Drillisch AG – a member of the United Internet Group – signed a preliminary agreement with Tele Columbus to use the latter’s cable/fiber optic network as a pre-service for its broadband products. The preliminary agreement is subject to the successful conclusion of the takeover offer.
United Internet’s participation in the bidding company is subject to conclusion of the takeover offer, which in turn depends on various conditions, including approval by the relevant supervisory authorities. Management anticipates a successful takeover and approval by the supervisory authorities.
Minority holdings in partner companies
In July 2013, United Internet acquired a stake in Open-Xchange AG (main activity: e-mail and collaboration solutions). United Internet has already been working successfully with the company for many years in its Applications business. As of December 31, 2020, United Internet’s share of voting rights amounted to 25.39%. In its fiscal year 2020, Open-Xchange improved sales slightly. However, due to internal restructuring, EBITDA remained slightly negative. The new management team assembled in 2020 will use the fiscal year 2021 for a strategic realignment of the company.
In April 2014, United Internet acquired a stake in uberall GmbH (main activity: online listings). In addition, uberall and 1&1 IONOS SE agreed a long-term cooperation contract for the use of uberall solutions. As of December 31, 2020, the share of voting rights held by United Internet amounted to 27.56%. uberall significantly increased sales in its fiscal year 2020. There was also a correspondingly significant improvement in the company’s EBITDA, although it remained slightly negative as a result of the expansion of business in the USA.
In April 2017, United Internet acquired a stake in rankingCoach International GmbH (main activity: online marketing solutions). In addition to the equity stake, rankingCoach and 1&1 IONOS SE signed a long-term cooperation agreement for 1&1 IONOS SE to use the online marketing solutions of rankingCoach as part of its hosting and cloud products marketed in Europe and North America. As of December 31, 2020, the share of voting rights amounted to 30.70%. rankingCoach also achieved a strong increase in sales in its fiscal year 2020. There was also an improvement in the company’s EBITDA – although it remained slightly negative.
Following the contribution of affilinet GmbH to AWIN in October 2017, United Internet also holds a stake in AWIN AG (main activity: affiliate marketing). Several United Internet subsidiaries are currently working together with AWIN and using the company’s affiliate network as part of their marketing mix. As of December 31, 2020, United Internet’s share of voting rights amounted to 20.00%. AWIN once again closed its fiscal year 2020 with strong sales growth and a further improved and strongly positive EBITDA result.
Share and dividend
Share
The United Internet share increased in value during fiscal 2020: the share price rose by 17.6% to € 34.43 as of December 31, 2020 (December 31, 2019: € 29.28). The share thus performed much better than its comparative indices, which also rose year on year (DAX +3.5%; MDAX +8.8%).
Share performance 2020, indexed
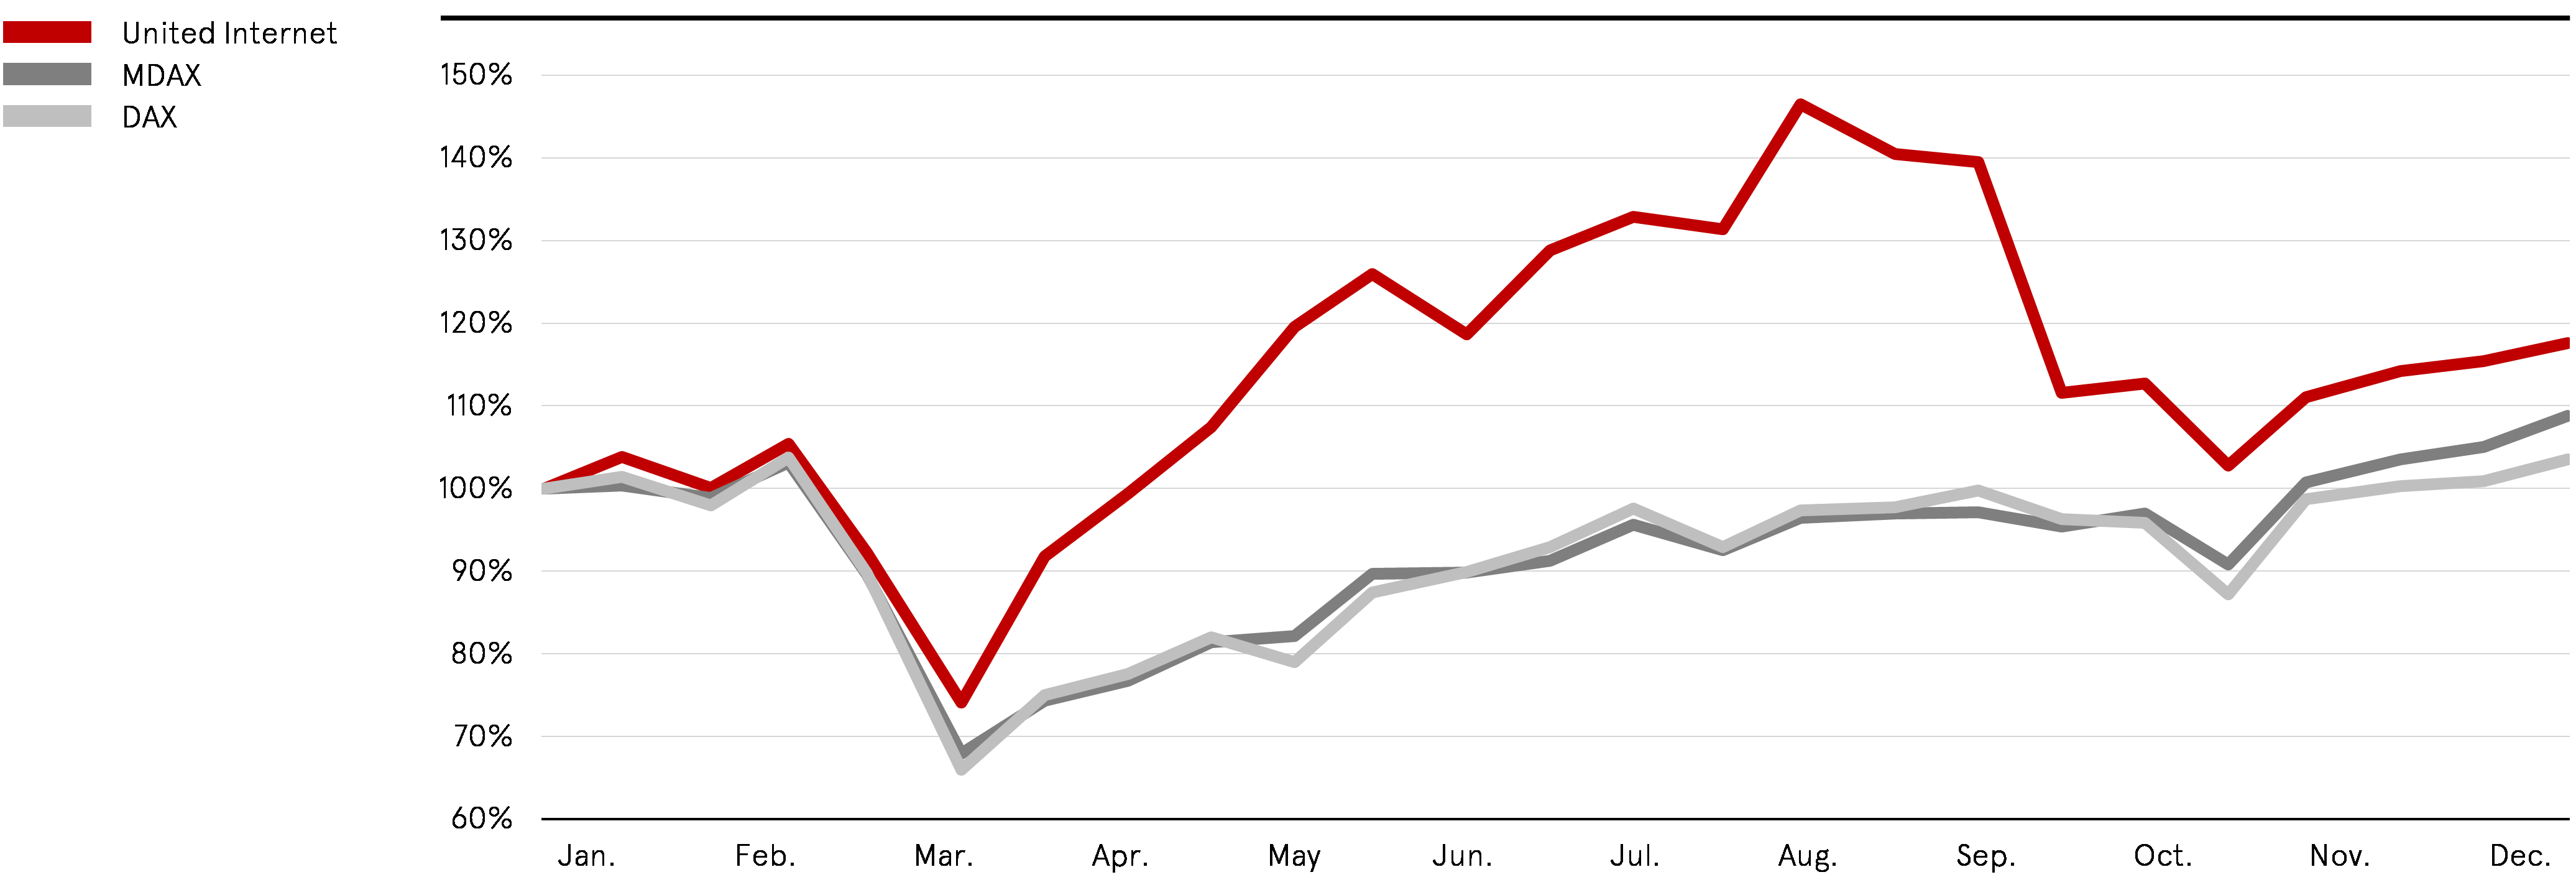
Despite the cancelation of 11 million treasury shares, there was a corresponding increase in the market capitalization of United Internet AG from around € 6.00 billion in the previous year to around € 6.68 billion as of December 31, 2020.
In the fiscal year 2020, average daily trading via the XETRA electronic computer trading system amounted to around 414,000 shares (prior year: 523,000) with an average value of € 13.4 million (prior year: € 16.4 million).
Multi-period overview: share performance (in €; all stock exchange figures are based on Xetra trading)
2016 | 2017 | 2018 | 2019 | 2020 | |
Year-end | 37.10 | 57.34 | 38.20 | 29.28 | 34.43 |
Performance | -27.1% | + 54.6% | -33.4% | -23.4% | + 17.6% |
Year-high | 49.89 | 59.17 | 59.80 | 40.42 | 43.88 |
Year-low | 34.42 | 37.01 | 34.14 | 24.21 | 22.01 |
Average daily turnover | 16,301,156 | 19,666,155 | 19,261,114 | 16,415,087 | 13,355,218 |
Average daily turnover (units) | 407,372 | 418,771 | 404,956 | 522,809 | 414,786 |
Shares at year-end (units) | 205 million | 205 million | 205 million | 205 million | 194 million |
Market value at year-end | 7.61 billion | 11.75 billion | 7.83 billion | 6.00 billion | 6.68 billion |
EPS(1) | 0.86 | 3.06 | 0.94 | 2.13 | 1.55 |
Adjusted EPS(2) | 2.11 | 2.02 | 1.96 | 1.88 | 1.76 |
(1) EPS from continued operations
(2) EPS from continued operations and without special items: 2015 without effects from sale of Goldbach shares and part of stake in virtual minds (EPS effect: € +0.07); 2016 without negative one-off effect from impairment (EPS effect: € -1.25); 2017 without net positive one-off effects from valuation topics, transaction and restructuring costs, writedowns on brands, writedowns on financial assets / Rocket impairment charges, financing costs and one-off tax effects (EPS effect: € +1.04); 2018 without negative effect from Tele Columbus impairment charges (EPS effect: € -1.02); 2019 without positive effects from sale of virtual minds shares (EPS effect: € +0.11), from reversal of impairments Tele Columbus (EPS effect: € +0.09) and trademark writeups Strato (EPS effect: € +0.05); 2020 without negative effect from write-off VDSL contingents (EPS effect: € -0.37) and positive effect from reversal of impairments Tele Columbus (EPS effect: € +0.16)
Share data
Share type | Registered common stock |
Notional share of capital stock | 1.00 € |
German Securities Identification Number (WKN) | 508903 |
International Securities Identification Number (ISIN) | DE0005089031 |
Ticker symbol Xetra | UTDI |
Reuters ticker symbol | UTDI.DE |
Bloomberg ticker symbol | UTDI.GR |
Segment | Prime Standard |
Index | MDAX, TecDAX |
Sector | Software |
Shareholder structure
Shareholder | Shareholding |
Ralph Dommermuth | 42.27% |
United Internet (treasury stock) | 3.49% |
Zerena | 5.45% |
Flossbach von Storch | 5.01% |
Allianz Global Investors | 4.99% |
Free float | 38.79% |
As of December 31, 2020; figures based on the last respective notification of voting rights; Flossbach von Storch: based on voting rights notification before capital reduction March 2020
Dividend
United Internet’s dividend policy aims to pay a dividend to shareholders of approx. 20-40% of adjusted consolidated net income after minority interests (adjusted consolidated net income attributable to the “shareholders of United Internet AG” – according to the consolidated statement of comprehensive income), provided that funds are not needed for further Company development.
At the (virtual) Annual Shareholders' Meeting of United Internet AG held on May 20, 2020, the proposal of the Management Board and Supervisory Board to pay a dividend of € 0.50 per share (prior year: € 0.05) for the fiscal year 2019, was approved with a majority of 99.99% of votes cast. As a consequence, a total of € 93.6 million (prior year: € 10.0 million) was distributed on May 26, 2020. The payout ratio was therefore 23.6% of the adjusted consolidated net income after minority interests for 2019 (€ 396.4 million) and thus – in view of the investments due to be made in the Company’s own mobile communications network – within the lower range targeted by its dividend policy.
For the fiscal year 2020, the Management Board of United Internet AG will propose to the Supervisory Board a dividend of € 0.50 per share (prior year: € 0.50). The Management Board and Supervisory Board will discuss this dividend proposal at the Supervisory Board meeting on March 24, 2021 (and thus after the preparation deadline for this Management Report). The Annual Shareholders' Meeting of United Internet AG on May 27, 2021 will then vote on whether to adopt the joint proposal of the Management Board and Supervisory Board.
On the basis of around 187.2 million shares with dividend entitlement (as of December 31, 2020), the total dividend payment for fiscal year 2020 would amount to € 93.6 million. The dividend payout ratio would therefore amount to 28.4% of adjusted consolidated net income after minority interests for 2020 (€ 329.2 million) and thus lie – in view of the investments due to be made in the Company’s own mobile communications network – within the medium range targeted by its dividend policy. Based on the closing price of the United Internet share on December 31, 2020, the dividend yield would be 1.5%.
Multi-period overview: dividend development
For 2016 | For 2017 | For 2018 | For 2019 | For 2020(1) | |
Dividend per share (in €) | 0.80 | 0.85 | 0.05 | 0.50 | 0.50 |
Dividend payment (in € million) | 161.3 | 169.9 | 10.0 | 93.9 | 93.6 |
Payout ratio | 90.0% | 26.2% | 5.3% | 22.2% | 32.2% |
Adjusted payout ratio(2) | 37.2% | 42.1% | 2.5% | 23.6% | 28.4% |
Dividend yield(3) | 2.2% | 1.5% | 0.1% | 1.7% | 1.5% |
(1) Subject to approval of Supervisory Board and Annual Shareholders' Meeting 2021
(2) Without special items: writedowns on financial assets / Rocket impairment charges (2016); net positive one-off effects from non-cash-effective valuation topics, transaction and restructuring costs, writedowns on brands, writedowns on financial assets / Rocket impairment charges, financing costs, one-off tax effects, and discontinued operations (2017); impairment charges on Tele Columbus shares (2018); sale of virtual minds shares, reversal of impairment charges on Tele Columbus shares and trademark writeups on Strato (2019); write-off VDSL contingents and reversal of impairments Tele Columbus (2020)
(3) As of: December 31
Annual Shareholders' Meeting 2020
The (virtual) Annual Shareholders' Meeting of United Internet AG was held in Frankfurt am Main on May 20, 2020. A total of 81.21% of capital stock (or 84.15% of capital stock less treasury shares) was represented. The shareholders adopted all resolutions on the agenda requiring voting with large majorities.
Capital stock and treasury shares
On March 12, 2020, the Management Board of United Internet AG resolved, with the approval of the Supervisory Board and on the basis of the authorization granted by the Annual Shareholders' Meeting of May 18, 2017 regarding the purchase and use of treasury shares, to cancel 11,000,000 treasury shares and to reduce the capital stock of United Internet AG by € 11,000,000, from € 205,000,000 to € 194,000,000. The pro rata amount of capital stock of the issued shares remains unchanged at € 1 per share. The cancelation of treasury shares serves to increase the shareholding of the United Internet shareholders on a percentage basis. Subsequent to the implementation of the capital decrease, the Company’s capital stock has thus returned to the level prior to the capital increase in the course of the Versatel takeover in 2014. After cancelling these 11,000,000 shares, United Internet still held 6,338,513 treasury shares – compared to 17,338,513 as of December 31, 2019.
On April 1, 2020, the Management Board of United Internet AG resolved, with the approval of the Supervisory Board, to launch a new share buyback program. In the course of this share buyback program, up to 5,000,000 shares of the Company (corresponding to approx. 2.58% of the capital stock of € 194,000,000) were to be bought back via the stock exchange. The Company was thus also utilizing the authorization issued by the Annual Shareholders' Meeting of May 18, 2017. The volume of the share buyback program amounted to up to € 150 million in total. The program commenced on April 3, 2020 and was to expire no later than on August 31, 2020. On April 30, 2020, the Company’s Management Board resolved to suspend this share buyback program with effect as of the end of that day’s trading (April 30, 2020). United Internet AG reserved the right to resume or cancel the share buyback program at any time. In the course of the share buyback program, the Company purchased 430,624 treasury shares for a total of € 12.2 million and thus held a total of 6,769,137 treasury shares (approx. 3.49% of the capital stock) as of April 30, 2020 (the day on which the program was suspended) as well as on the balance sheet date December 31, 2020 – compared to 17,338,513 treasury shares on December 31, 2019 (this corresponded to approx. 8.46% of capital stock at the time).
Investor Relations
Continuous and transparent corporate communication with all capital market participants is important for United Internet. The Company aims to provide all target groups with timely information without discrimination. To this end, the Management Board and the Investor Relations department continued their regular discussions with institutional and private investors in the fiscal year 2020. However, the coronavirus pandemic meant that this intensive exchange was not possible to the same extent or in the same way as before. The capital market was informed via the quarterly statements, half-year financial report and annual report, press and analyst conferences, as well as via various webcasts, whereby all conferences were held virtually. The Company’s management and Investor Relations department explained the Company’s strategy and financial results in numerous one-on-one discussions at the Company’s offices in Montabaur, as well as at virtual roadshows with mainly European and North American investors.
Over 20 national and international investment banks are in contact with the Company’s Investor Relations department and publish regular studies and comments on the Company’s progress and share performance. The latest analyst recommendations can be found on the website www.united-internet.de in the Investor Relations section under Analyst Coverage.
Apart from one-on-one meetings, shareholders and potential future investors can also receive the latest news around the clock via the Company’s extensive and bilingual website (www.united-internet.de). In addition to the publication dates of financial reports, the dates and venues of investor conferences and roadshows are made publicly available at https://www.united-internet.de/en/investor-relations/financial-calendar.html.
Personnel report
As a telecommunications and internet company, United Internet is subject to the defining characteristics of the industry: rapid change, short innovation cycles, and fierce competition. United Internet AG has risen to these challenges with great success over many years now. One of the key factors for the success and growth of the United Internet Group are its dedicated and highly competent employees and executives with their entrepreneurial and autonomous approach to work. The Company therefore attaches great importance to a sustainable and balanced strategy across all aspects of its HR activities: from employee recruitment, to targeted entry-level and vocational training formats, tailored skills training programs, support with individual career paths, through to sustainable management development programs, and the long-term retention of executives, high potentials and top performers.
United Internet AG was once again recognized as a top employer in 2020. Based on an independent study of the “Top Employers Institute”, United Internet received the “TOP Employers Germany” award – as in the preceding years. Certification is only awarded to organizations which offer staff attractive working conditions. Assessment is based on career opportunities, employer benefits, and working conditions, as well as training and development opportunities.
Headcount and personnel expenses
In the highly competitive market for skilled workers in the ICT sector, United Internet once again succeeded in recruiting top staff for its key positions and thus meeting the needs of its growing business. In addition to targeted employer branding, partnerships with education and training providers, and the positive impact of the Company’s product brands, our successful recruitment efforts center around a candidate-friendly, highly competitive acquisition and selection process.
In the fiscal year 2020, the number of employees increased year on year by 2.8% to 9,638 (prior year: 9,374). Headcount in Germany rose by 2.2% to 7,929 as of December 31, 2020 (prior year: 7,761). The number of employees at the Group’s non-German subsidiaries grew by 6.0% to 1,709 (prior year: 1,613).
Multi-period overview: headcount development by location(1)
2016 | 2017 | 2018 | 2019 | 2020 | Change | |
Employees, total | 7,897 | 9,414 | 9,093 | 9,374 | 9,638 | + 2.8% |
thereof in Germany | 6,322 | 7,890 | 7,567 | 7,761 | 7,929 | + 2.2% |
thereof abroad | 1,575 | 1,524 | 1,526 | 1,613 | 1,709 | + 6.0% |
(1) Active employees as of December 31 of the respective fiscal year
From the segment perspective, there were 3,191 employees in the Consumer Access segment (prior year: 3,163), 1,188 in the Business Access segment (prior year: 1,184), 1,005 in the Consumer Applications segment (prior year: 1,007), and 3,631 in the Business Applications segment (prior year: 3,416). A further 623 people were employed at the Group’s headquarters (Corporate/HQ) (prior year: 604). The gradual increase in Corporate/HQ staff resulted in particular from the transfer of employees from the segments who already worked in corporate functions in the past, as well as from the pooling of apprentices in a specially created company.
Multi-period overview: headcount development by segment (1)
2016 | 2017 | 2018 | 2019 | 2020 | Change | |
Employees, total | 7,897 | 9,414 | 9,093 | 9,374 | 9,638 | + 2.8% |
thereof Consumer Access | 2,401 | 3,457 | 3,150 | 3,163 | 3,191 | + 0.9% |
thereof Business Access | 1,077 | 1,069 | 1,095 | 1,184 | 1,188 | + 0.3% |
thereof Consumer Applications | 978 | 961 | 947 | 1,007 | 1,005 | -0.2% |
thereof Business Applications | 3,243 | 3,586 | 3,355 | 3,416 | 3,631 | + 6.3% |
thereof Corporate/HQ | 198 | 341 | 546 | 604 | 623 | + 3.1% |
(1) Active employees as of December 31 of the respective fiscal year
Personnel expenses rose by 7.1% to € 592.3 million in the fiscal year 2020 (prior year: € 552.8 million). The personnel expense ratio thus amounted to 11.0% (prior year: 10.6%).
Multi-period overview: development of personnel expenses
in € million | 2016 | 2017 | 2018 | 2019 | 2020 | Change |
Personnel expenses | 433.8 | 489.0 | 538.8 | 552.8 | 592.3 | + 7.1% |
Personnel expense ratio | 11.4% | 11.6% | 10.5% | 10.6% | 11.0% | |
Sales per employee, based on annual average headcount, amounted to approx. € 565k in fiscal year 2020 (prior year: approx. € 563k).
Diversity
Respect for diversity is a core aspect of United Internet’s corporate culture. The reason for this is simple: only a workforce that mirrors the many different facets of society offers the best possible conditions for creativity and productivity, and makes employees – and the organization itself – unique. This unique diversity creates an incomparable wealth of potential ideas and innovations, increasing the Company’s competitiveness and providing opportunities for all.
All United Internet employees are to be treated with respect and should receive the same opportunities, regardless of their nationality, ethnic origin, religion, ideological beliefs, gender and gender identity, age, disability, or sexual orientation and identity. Each employee should be able to find the area of activity and function in which they can make the most of their individual potential and talents.
Multi-period overview: employees by gender(1)
2016 | 2017 | 2018 | 2019 | 2020 | |
Women | 34% | 31% | 32% | 32% | 32% |
Men | 66% | 69% | 68% | 68% | 68% |
(1) Active employees as of December 31 of the respective fiscal year
The average age of the United Internet Group’s employees at the end of fiscal year 2020 was around 39 (prior year: 38).
Multi-period overview: employee age profile(1)
2016 | 2017 | 2018 | 2019 | 2020 | |
28% | 24% | 26% | 23% | 23% | |
30 – 39 | 41% | 36% | 38% | 34% | 33% |
40 – 49 | 23% | 27% | 25% | 27% | 27% |
≥ 50 | 8% | 13% | 11% | 16% | 17% |
(1) Active employees as of December 31 of the respective fiscal year
Employees of United Internet AG work in an international environment at over 30 sites around the world.
Multi-period overview: employees by country(1)
2016 | 2017 | 2018 | 2019 | 2020 | |
Employees, total | 7,897 | 9,414 | 9,093 | 9,374 | 9,638 |
thereof Germany | 6,322 | 7,890 | 7,567 | 7,761 | 7,929 |
thereof France | 3 | 3 | 3 | 3 | 3 |
thereof UK | 209 | 232 | 216 | 233 | 251 |
thereof Austria | 6 | 5 | 37 | 43 | 44 |
thereof Philippines | 386 | 366 | 351 | 360 | 395 |
thereof Poland | 258 | 251 | 270 | 309 | 299 |
thereof Romania | 194 | 174 | 176 | 195 | 217 |
thereof Spain | 322 | 319 | 331 | 330 | 340 |
thereof USA | 197 | 174 | 142 | 140 | 160 |
(1) Active employees as of December 31 of the respective fiscal year
For further information on topics such as “HR Strategy and HR Organization”, “Training and Education”, “Diversity and Equal Opportunities” and “Occupational Health and Safety”, please refer to the chapter “United Internet as an Employer” in the Sustainability Report 2020 of United Internet AG, which will be published in early April 2021 (at https://www.united-internet.de/en/investor-relations/publications/reports.html).
Liquidity and finance
The Group’s financial strategy is primarily geared to the strategic business plans of its operating business units. In order to provide sufficient flexibility for further growth, United Internet therefore constantly monitors trends in funding opportunities arising on the financial markets. Various options for funding and potential for optimizing existing financial instruments are regularly reviewed. The main focus is on ensuring sufficient liquidity and the financial independence of the Group at all times. In addition to its own financial strength, the Group maintains sufficient liquidity reserves with core banks. The flexible use of these liquidity reserves enables efficient management of Group liquidity, optimal debt management to reduce interest costs, and the avoidance of negative interest on deposits.
As of December 31, 2020, the Group’s bank liabilities amounted to € 1,466.1 million (prior year: € 1,738.4 million) and mainly comprise promissory note loansand syndicated loans.
Promissory note loans
At the end of the reporting period on December 31, 2020, total liabilities from promissory note loanswith maximum terms until March 2025 amounted to € 547.5 million (prior year: € 835.5 million). In the fiscal year 2020, the Company exercised its right to prematurely redeem a variable-rate tranche of promissory note loans totaling € 50 million on the interest payment date of March 27, 2020. This tranche was originally due for repayment on March 27, 2023. In addition, a further promissory note loan due in December 2020 amounting to € 238 million was redeemed on schedule.
Syndicated loan facilities & syndicated loans
A banking syndicate has granted United Internet AG a revolving syndicated loan facility totaling € 810 million until January 2025. In the fiscal year 2020, the Company made use of a contractually agreed prolongation option and extended the term of the revolving syndicated loan facility agreed on December 21, 2018 for the period from January 2025 to January 2026. A credit facility of € 690 million was agreed for this prolongation period. As of December 31, 2020, € 550 million of the revolving syndicated loan facility had been drawn (prior year: € 700 million). As a result, funds of € 260 million (prior year: € 110 million) were still available to be drawn from the credit facility.
At the end of the reporting period on December 31, 2020, a syndicated loan totaling € 200 million redeemable on maturity with a term ending in August 2021 was also outstanding (prior year: € 200 million). Together with the above mentioned drawings from the revolving syndicated loan facility, total liabilities from syndicated loan facilities and syndicated loans outstanding as of the reporting period amounted to € 750 million.
Furthermore, a bilateral credit facility of € 280 million (prior year: € 200 million) is available to the Company. The facility has been granted until further notice. Drawings of € 165 million (prior year: € 0) had been made from the credit facility as at the end of the reporting period.
As of December 31, 2020, United Internet therefore had free credit lines totaling € 375 million.
Further disclosures on the various financial instruments, drawings, interest rates, and maturities are provided under note 31 of the Notes to the Consolidated Financial Statements.