

2.3 Position of the Group
There were no significant acquisition or divestment effects on consolidated and segment sales and EBITDA in the fiscal year 2022. There were also only minor positive currency effects at Group and segment level (mainly Business Applications segment) amounting to € 31.8 million for sales and € 5.0 million for EBITDA. The same applies to the Group’s asset position, for which there were no significant effects from currency fluctuations.
Group’s earnings position
In the fiscal year 2022, the total number of fee-based customer contracts in the United Internet Group grew by 730,000 to 27.46 million contracts. At the same time, ad-financed free accounts rose by 40,000 to 40.31 million.
Consolidated sales increased by 4.8% in the fiscal year 2022, from € 5,646.2 million in the previous year to € 5,915.1 million. Due in part to positive currency effects of € 31.8 million, sales outside Germany improved by 21.7% from € 513.8 million to € 625.5 million.
The cost of sales rose from € 3,684.9 million to € 3,906.3 million during the reporting period. As a result, the cost of sales ratio increased from 65.3% (of sales) in the previous year to 66.0% (of sales). This deterioration was due in particular to a (non-period) positive effect of € +39.4 million in the previous year attributable to the second half of 2020. There was a corresponding decline in the gross margin from 34.7% to 34.0% and consequently the increase in gross profit of 2.4% from € 1,961.2 million to € 2,008.7 million fell short of sales growth (4.8%).
Due in part to costs for the announced additional marketing activities of IONOS to raise brand awareness in its most important European markets, sales and marketing expenses increased faster than sales, from € 835.7 million (14.8% of sales) in the previous year to € 907.2 million (15.3% of sales).
By contrast, there was a disproportionately slower increase in administrative expenses from € 243.0 million (4.3% of sales) to € 248.5 million (4.2% of sales).
Multi-period overview: Development of key cost items
Cost of sales | 3,350.1 | 3,427.0 | 3,769.3 | 3,684.9 (1) | 3,906.3 |
Cost of sales ratio | 65.7% | 66.0% | 70.2% | 65.3% | 66.0% |
Gross margin | 34.3% | 34.0% | 29.8% | 34.7% | 34.0% |
Selling expenses | 678.2 | 741.8 | 767.9 | 835.7 | 907.2 |
Selling expenses ratio | 13.3% | 14.3% | 14.3% | 14.8% | 15.3% |
Administrative expenses | 218.9 | 205.9 | 206.0 | 243.0 | 248.5 |
Administrative expenses ratio | 4.3% | 4.0% | 3.8% | 4.3% | 4.2% |
in € million | 2018 (IFRS 15) | 2019 (IFRS 16) | 2020 | 2021 | 2022 |
(1) Including the non-period positive effect on earnings attributable to the second half of 2020 (EBITDA and EBIT effect: € +39.4 million)
Other operating expenses increased from € -21.2 million to € -46.5 million and other operating income from € 54.8 million in the previous year to € 92.3 million. Due to an increase in payment defaults, impairment losses on receivables and contract assets rose from € -86.3 million to € -117.4 million.
Key earnings figures were influenced by various special items in the fiscal years 2022 and 2021, which in total had a net negative effect in 2022 and a positive effect in 2021.
Special items 2022
- The special item “IPO costs IONOS in 2022” results from one-off costs in connection with the planned IPO of Group subsidiary IONOS Group SE and had a negative impact on EBITDA, EBIT, EBT, net income, and EPS in the fiscal year 2022.
- The special item “non-cash valuation effect from derivatives in 2022“ results from quarterly revaluations of derivatives and had a net negative impact on EBITDA, EBIT, EBT, net income, and EPS in the fiscal year 2022.
Special items 2021
- The special item “non-period effect from lower MBA MVNO prices in 2021” results from retroactively more favorable advance service prices for mobile communications in the second half of 2020 in connection with the national roaming agreement with Telefónica concluded on May 21, 2021 and had a non-period positive impact on EBITDA, EBIT, EBT, net income, and EPS for the first time in the fiscal year 2021.
- The special item “non-cash valuation effect from derivatives in 2021“ results from quarterly revaluations of derivatives and had a positive impact on EBITDA, EBIT, EBT, net income, and EPS in the fiscal year 2021.
- The special item “IPO costs IONOS in 2021” results from one-off costs in connection with the planned IPO of Group subsidiary IONOS Group SE and had a negative impact on EBITDA, EBIT, EBT, net income, and EPS in the fiscal year 2021.
Reconciliation of EBITDA, EBIT, EBT, net income, and EPS with figures adjusted for special items
EBITDA | 1,262.5 | 1,303.7 |
IPO costs IONOS in 2022 | 8.8 | |
Non-cash valuation effect from derivatives in 2022 | 0.5 | |
Non-period effect from lower MBA MVNO prices in 2021 | -39.4 | |
Non-cash valuation effect from derivatives in 2021 | -4.9 | |
IPO costs IONOS in 2021 | 3.0 | |
EBITDA adjusted for special items (operating) | 1,271.8 | 1,262.4 |
EBIT | 781.4 | 829.9 |
IPO costs IONOS in 2022 | 8.8 | |
Non-cash valuation effect from derivatives in 2022 | 0.5 | |
Non-period effect from lower MBA MVNO prices in 2021 | -39.4 | |
Non-cash valuation effect from derivatives in 2021 | -4.9 | |
IPO costs IONOS in 2021 | 3.0 | |
EBIT adjusted for special items (operating) | 790.7 | 788.6 |
EBT | 711.5 | 773.3 |
IPO costs IONOS in 2022 | 8.8 | |
Non-cash valuation effect from derivatives in 2022 | 0.5 | |
Non-period effect from lower MBA MVNO prices in 2021 | -39.4 | |
Non-cash valuation effect from derivatives in 2021 | -4.9 | |
IPO costs IONOS in 2021 | 3.0 | |
EBT adjusted for special items (operating) | 720.8 | 732.0 |
Net income | 464.7 | 523.2 |
IPO costs IONOS in 2022 | 8.7 | |
Non-cash valuation effect from derivatives in 2022 | 0.4 | |
Non-period effect from lower MBA MVNO prices in 2021 | -27.0 | |
Non-cash valuation effect from derivatives in 2021 | -3.4 | |
IPO costs IONOS in 2021 | 2.9 | |
Net income adjusted for special items (operating) | 473.8 | 495.7 |
Net income "Shareholders United Internet" | 367.2 | 416.5 |
IPO costs IONOS in 2022 | 6.5 | |
Non-cash valuation effect from derivatives in 2022 | 0.4 | |
Non-period effect from lower MBA MVNO prices in 2021 | -20.7 | |
Non-cash valuation effect from derivatives in 2021 | -3.4 | |
IPO costs IONOS in 2021 | 2.1 | |
Net income "Shareholders United Internet" adjusted for special items (operating) | 374.1 | 394.5 |
EPS | 1.97 | 2.23 |
IPO costs IONOS in 2022 | 0.03 | |
Non-cash valuation effect from derivatives in 2022 | 0.00 | |
Non-period effect from lower MBA MVNO prices in 2021 | -0.11 | |
Non-cash valuation effect from derivatives in 2021 | -0.02 | |
IPO costs IONOS in 2021 | 0.01 | |
EPS adjusted for special items (operating) | 2.00 | 2.11 |
in € million; EPS in € | Fiscal year 2022 | Fiscal year 2021 |
Without consideration of the above mentioned opposing special items, the key performance measures EBITDA, EBIT, EBT, net income, and EPS for the fiscal year 2022 developed as follows:
Consolidated operating EBITDA rose by 0.7% from € 1,262.4 million in the previous year to € 1,271.8 million. In addition to higher electricity costs (€ -22.4 million), this at first glance only moderate growth was due to expenses for the construction of 1&1’s mobile communications network (€ -51.7 million; prior year: € -37.9 million), which were mainly incurred (€ -25.6 million) in the fourth quarter, and costs for the announced additional marketing activities to raise brand awareness in the most important European markets of IONOS (€ -32.4 million), which were also mainly incurred (€ -19.8 million) in the fourth quarter.
Consolidated operating EBIT was equally affected by these costs and remained virtually unchanged at € 790.7 million (prior year: € 788.6 million).
There was a corresponding fall in the operating EBITDA margin and the operating EBIT margin from 22.4% to 21.5% and from 14.0% to 13.4%, respectively.
The number of Group employees rose by 5.0% to 10,474 (prior year: 9,975).
Key sales and earnings figures of the Group (in € million)
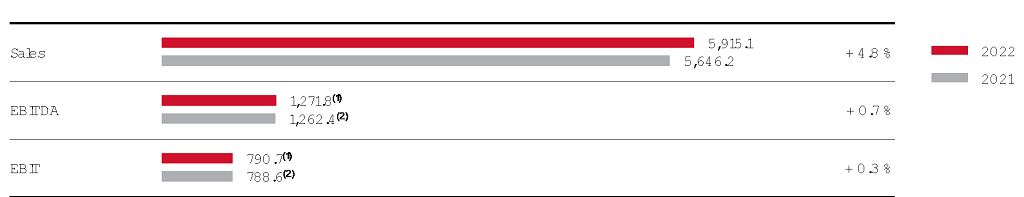
(1) Excluding a non-cash valuation effect from derivatives (EBITDA and EBIT effect: € -0.5 million) and excluding IPO costs IONOS (EBITDA and EBIT effect: € -8.8 million)
(2) Excluding the non-period positive effect on earnings attributable to the second half of 2020 (EBITDA and EBIT effect: € +39.4 million), excluding a non-cash valuation effect from derivatives (EBITDA and EBIT effect: € +4.9 million) and excluding IPO costs IONOS (EBITDA and EBIT effect: € -3.0 million)
Quarterly development ; change over prior-year quarter
Sales | 1,443.7 | 1,457.4 | 1,483.2 | 1,530.8 | 1,478.3 | + 3.6% |
EBITDA | 330.1 (1) | 327.4 (1) | 329.0 (1) | 285.3 (1) | 310.3 (2) | - 8.1% |
EBIT | 210.3 (1) | 207.0 (1) | 207.9 (1) | 165.5 (1) | 187.1 (2) | - 11.5% |
in € million | Q1 2022 | Q2 2022 | Q3 2022 | Q4 2022 | Q4 2021 | Change |
(1) Excluding a non-cash valuation effect from derivatives (EBITDA and EBIT effect: € +0.8 million in Q1 2022; € +3.8 million in Q2 2022; € +7.6 million in Q3 2022; € -12.7 million in Q4 2022) and excluding IPO costs IONOS (EBITDA and EBIT effect: € -0.9 million in Q1 2022; € -1.5 million in Q2 2022; € -0.8 million in Q3 2022; € -5.6 million in Q4 2022)
(2) Excluding a non-cash valuation effect from derivatives (EBITDA and EBIT effect: € +1.9 million in Q4 2021) and excluding IPO costs IONOS (EBITDA and EBIT effect: € -3.0 million in Q4 2021)
Multi-period overview: Development of key sales and earnings figures
Sales | 5,102.9 | 5,194.1 | 5,367.2 | 5,646.2 | 5,915.1 |
EBITDA | 1,201.3 | 1,244.2 (1) | 1,218.2 (2) | 1,262.4 (3) | 1,271.8 (4) |
EBITDA margin | 23.5% | 24.0% | 22.7% | 22.4% | 21.5% |
EBIT | 811.0 | 770.2 (1) | 744.2 (2) | 788.6 (3) | 790.7 (4) |
EBIT margin | 15.9% | 14.8% | 13.9% | 14.0% | 13.4% |
in € million | 2018 (IFRS 15) | 2019 (IFRS 16) | 2020 | 2021 | 2022 |
(1) Excluding extraordinary income from the sale of virtual minds shares (EBITDA and EBIT effect: € +21.5 million) and excluding trademark writeups Strato (EBIT effect: € +19.4 million)
(2) Including the non-period positive effect on earnings in 2021 attributable to the second half of 2020 (EBITDA and EBIT effect: € +39.4 million) and excluding write-off of VDSL contingents that are still available (EBITDA and EBIT effect: € -129.9 million)
(3) Excluding the non-period positive effect on earnings attributable to the second half of 2020 (EBITDA and EBIT effect: € +39.4 million), excluding a non-cash valuation effect from derivatives (EBITDA and EBIT effect: € +4.9 million) and excluding IPO costs IONOS (EBITDA and EBIT effect: € -3.0 million)
(4) Excluding a non-cash valuation effect from derivatives (EBITDA and EBIT effect: € -0.5 million) and excluding IPO costs IONOS (EBITDA and EBIT effect: € -8.8 million)
In contrast to operating EBITDA and operating EBIT, operating earnings before taxes (EBT) of € 720.8 million were 1.5% down on the previous year (€ 732.0 million). Likewise, operating consolidated net income and operating consolidated net income attributable to shareholders of United Internet AG also fell from € 495.7 million to € 473.88 million and from € 394.5 million to € 374.1 million, respectively.
This decline in the aforementioned key operating figures was mainly due to a year-on-year decrease in the financial result, which was impacted in part by the subsequent measurement of financial derivatives (EBT effect: € -7.4 million; prior year: € -0.5 million / net income effect: € -5.2 million; prior year: € -0.3 million / net income of shareholders effect: € -4.8 million; prior year: € +3.1 million / EPS effect: € -0.03; prior year: € +0.02), as well as – with regard to the result from associated companies – the prorated negative result of Kublai GmbH, which was only partially included in the comparative figures for 2021 (eight months as opposed to twelve months in 2022) as the takeover of Tele Columbus AG was only completed during the course of the previous year (EBT effect: € -35.1 million; prior year: € -25.0 million / net income effect: € -35.1 million; prior year: € -25.0 million / net income of shareholders effect:€ -35.1 million; prior year: € -25.0 million / EPS effect: € -0.19; prior year: € -0.13).
Against this backdrop, operating earnings per share (EPS) of € 2.00 were below the prior-year figure (€ 2.11) and operating EPS before PPA amortization (purchase price allocation as part of a company acquisition) of € 2.38 was down on the previous year (€ 2.52). The PPA effects amounted to € -0.38 in 2022, compared to € -0.41 in the previous year.
Group’s financial position
Despite the decline in net income to € 464.7 million (compared to € 523.2 million in the previous year), operative cash flow rose slightly from € 987.8 million in the previous year to € 991.8 million in the fiscal year 2022.
At € 597.5 million, however, cash flow from operating activities in the fiscal year 2022 was well below the prior-year figure (€ 887.6 million). In addition to phasing effects, this was mainly attributable to higher sales tax payments (€ -115.3 million) due to changes in sales tax legislation in 2021.
Cash flow from investing activities displayed a net outflow of € 703.5 million in the reporting period (prior year: € 527.3 million). This resulted mainly from greatly increased capital expenditures of € 681.4 million (prior year: € 289.8 million) due to the rollout of the 5G mobile network and expansion of the fiber-optic network, as well as payments to acquire shares in associated companies, especially for the capital increase of Tele Columbus AG, amounting to € 30.7 million (prior year: € 226.3 million, especially for the stake in Kublai GmbH). Cash flow from investing activities in the previous year was also dominated by payments of € 20.6 million to acquire shares in affiliates (especially for the acquisition of we22 GmbH (formerly: we22 AG)).
United Internet’s free cash flow is defined as cash flow from operating activities, less capital expenditures, plus payments from disposals of intangible assets and property, plant, and equipment. In the fiscal year 2022, free cash flow decreased from € 495.2 million in the previous year to € -205.5 million. After deducting the cash flow item “Redemption of lease liabilities” – disclosed in cash flow from financing activities since the initial application of the accounting standard IFRS 16 – free cash flow fell from € 600.8 million to € -79.4 million.
In addition to the already lower net income (€ -58.3 million), this decline in free cash flow was due in particular to the strong rise in capital expenditures (€ -391.6 million), the increased redemption of lease liabilities (€ -20.4 million), the strong reduction of trade accounts payable (phasing effects of € -97.2 million from Q4 2021), and higher sales tax payments (€ -115.3 million) due to changes in sales tax legislation.
Cash flow from financing activities in the fiscal year 2022 was dominated by the net assumption of loans totaling € 332.8 million (prior year: € 353.0 million), the redemption of spectrum liabilities of € 61.3 million (prior year: € 61.3 million), the redemption of lease liabilities of € 126.0 million (prior year: € 105.6 million), the dividend payment of € 93.4 million (prior year: € 93.6 million), as well as the payment of € 18.2 million to minority shareholders, especially for the increased shareholding (to 100%) in InterNetX Holding GmbH (prior year: € 456.8 million, especially for the increased shareholding in IONOS Group SE (formerly: IONOS TopCo SE) and in 1&1 AG).
Cash and cash equivalents amounted to € 40.5 million as of December 31, 2022 – due to closing-date effects – compared to € 110.1 million on the same date in the previous year.
Development of key cash flow figures
Operative cash flow | 991.8 | 987.8 | + 4.0 |
Cash flow from operating activities | 597.5 | 887.6 | - 290.1 |
Cash flow from investing activities | -703.5 | -527.3 | - 176.2 |
Free cash flow (1) | -205.5 (2) | 495.2 (2) | - 700.7 |
Cash flow from financing activities | 35.1 | -386.1 | + 421.2 |
Cash and cash equivalents on December 31 | 40.5 | 110.1 | - 69.6 |
in € million | 2022 | 2021 | Change |
(1) Free cash flow is defined as cash flow from operating activities, less capital expenditures, plus payments from disposals of intangible assets and property, plant and equipment
(2) 2022 including the repayment portion of lease liabilities (€ 126.0 million), which have been reported under cash flow from financing activities since the fiscal year 2019 (IFRS 16)
(3) 2021 including the repayment portion of lease liabilities (€ 105.6 million), which have been reported under cash flow from financing activities since the fiscal year 2019 (IFRS 16)
Multi-period overview: Development of key cash flow figures
Operative cash flow | 889.5 | 935.0 | 954.1 | 987.8 | 991.8 |
Cash flow from operating activities | 482.3 | 828.9 | 925.7 | 887.6 | 597.5 |
Cash flow from investing activities | -350.9 | 87.2 | -361.1 | -527.3 | -703.5 |
Free cash flow (1) | 254.6 (2) | 496.0 (3) | 376.6 (4) | 495.2 (4) | -205.5 (4) |
Cash flow from financing activities | -312.6 | -857.6 | -549.1 | -386.1 | 35.1 |
Cash and cash equivalents on December 31 | 58.1 | 117.6 | 131.3 | 110.1 | 40.5 |
in € million | 2018 (IFRS 15) | 2019 (IFRS 16) | 2020 | 2021 | 2022 |
(1) Free cash flow is defined as cash flow from operating activities, less capital expenditures, plus payments from disposals of intangible assets and property, plant and equipment
(2) 2018 without tax payment from fiscal year 2016 (€ 34.7 million)
(3) 2019 without capital gains tax payment (€ 56.2 million) and without tax payments from fiscal year 2017 and previous years (€ 27.2 million) and including the repayment portion of lease liabilities, which have been reported under cash flow from financing activities since the fiscal year 2019 (IFRS 16)
(4) 2020, 2021 and 2022 including the repayment portion of lease liabilities, which have been reported under cash flow from financing activities since the fiscal year 2019 (IFRS 16)
For further details on guarantees, leases, and other financial obligations, please refer to chapter 2.2 “Business development”, “Liquidity and finance”, as well as note 45 of the Notes to the Consolidated Financial Statements.
Group’s asset position
The balance sheet total increased from € 9.669 billion as of December 31, 2021 to € 10.332 billion on December 31, 2022.
Development of current assets
Cash and cash equivalents | 40.5 | 110.1 | - 69.6 |
Trade accounts receivable | 418.8 | 380.5 | + 38.4 |
Contract assets | 648.4 | 619.7 | + 28.7 |
Inventories | 120.6 | 96.5 | + 24.1 |
Prepaid expenses | 282.1 | 214.0 | + 68.1 |
Other financial assets | 106.6 | 119.0 | - 12.4 |
Income tax claims | 34.7 | 46.4 | - 11.6 |
Other non-financial assets | 19.7 | 8.1 | + 11.6 |
Total current assets | 1,671.4 | 1,594.2 | + 77.2 |
in € million | Dec. 31, 2022 | Dec. 31, 2021 | Change |
Current assets rose from € 1,594.2 million on December 31, 2021 to € 1,671.4 million as of December 31, 2022. However, cash and cash equivalents disclosed under current assets decreased from € 110.1 million to € 40.5 million due to closing-date effects. By contrast, trade accounts receivable rose from € 380.5 million to € 418.8 million due to closing-date effects and the expansion of business. As a result of customer growth, the item current contract assets rose from € 619.7 million to € 648.4 million and includes current claims against customers due to accelerated revenue recognition from the application of IFRS 15. In order to avoid supply bottlenecks, inventories were raised from € 96.5 million to € 120.6 million. Due to prepayments made to advance service providers and closing-date effects, current prepaid expenses increased from € 214.0 million to € 282.1 million and mainly comprise the short-term portion of expenses relating to contract acquisition and contract fulfillment according to IFRS 15. The items current other financial assets, income tax claims, and other non-financial assets were largely unchanged.
Development of non-current assets
Shares in associated companies | 429.3 | 431.6 | - 2.3 |
Other financial assets | 10.7 | 11.6 | - 0.9 |
Property, plant and equipment | 1,851.0 | 1,379.6 | + 471.4 |
Intangible assets | 2,029.3 | 2,059.4 | - 30.2 |
Goodwill | 3,623.4 | 3,627.8 | - 4.4 |
Trade accounts receivable | 41.4 | 47.3 | - 5.9 |
Contract assets | 216.7 | 206.0 | + 10.8 |
Prepaid expenses | 429.0 | 287.7 | + 141.2 |
Deferred tax assets | 56.3 | 23.8 | + 32.5 |
Total non-current assets | 8,687.1 | 8,074.9 | + 612.2 |
in € million | Dec. 31, 2022 | Dec. 31, 2021 | Change |
Non-current assets rose from € 8,074.9 million as of December 31, 2021 to € 8,687.1 million on December 31, 2022. Capital expenditures in 2022 (especially for the 5G network rollout and expansion of the fiber-optic network in the Consumer Access and Business Access segments) led to a strong increase in property, plant and equipment from € 1,379.6 million to € 1,851.0 million, while intangible assets declined from € 2,059.4 million to € 2,029.3 million mainly as a result of amortization. Due to prepayments made to advance service providers and closing-date effects, non-current prepaid expenses rose strongly from € 287.7 million to € 429.0 million. Deferred tax assets rose from € 23.8 million to € 56.3 million. The items shares in associated companies, non-current other financial assets, goodwill, non-current trade accounts receivable, and non-current contract assets were all largely unchanged.
Development of current liabilities
Trade accounts payable | 561.5 | 583.4 | - 21.9 |
Liabilities due to banks | 656.7 | 325.4 | + 331.3 |
Income tax liabilities | 52.7 | 58.4 | - 5.7 |
Contract liabilities | 157.1 | 157.9 | - 0.8 |
Other accrued liabilities | 5.1 | 16.2 | - 11.2 |
Other financial liabilities | 333.6 | 329.2 | + 4.4 |
Other non-financial liabilities | 69.0 | 135.7 | - 66.8 |
Total current liabilities | 1,835.6 | 1,606.2 | + 229.4 |
in € million | Dec. 31, 2022 | Dec. 31, 2021 | Change |
Current liabilities increased from € 1,606.2 million as of December 31, 2021 to € 1,835.6 million on December 31, 2022. Due to closing-date effects, current trade accounts payable decreased from € 583.4 million to € 561.5 million. There was an increase in current liabilities due to banks from € 325.4 million to € 656.7 million, largely as a result of reclassifications from non-current liabilities (in accordance with their maturity) as well as the use of new and existing short-term credit facilities. Current other non-financial liabilities decreased from € 135.7 million to € 69.0 million and mainly include liabilities due to tax authorities as of the respective balance sheet date. The items income tax liabilities, current contract liabilities, which mainly include payments received from customer contracts for which the performance has not yet been completely rendered, as well as current other accrued liabilities, and current other financial liabilities were all virtually unchanged.
Development of non-current liabilities
Liabilities due to banks | 1,498.8 | 1,497.4 | + 1.5 |
Deferred tax liabilities | 309.7 | 290.5 | + 19.2 |
Trade accounts payable | 4.3 | 2.5 | + 1.8 |
Contract liabilities | 31.3 | 32.2 | - 0.9 |
Other accrued liabilities | 67.1 | 66.0 | + 1.0 |
Other financial liabilities | 1,313.3 | 1,251.2 | + 62.1 |
Total non-current liabilities | 3,224.5 | 3,139.7 | + 84.8 |
in € million | Dec. 31, 2022 | Dec. 31, 2021 | Change |
Non-current liabilities increased from € 3,139.7 million as of December 31, 2021 to € 3,224.5 million on December 31, 2022. This was due in particular to the rise in other financial liabilities from € 1,251.2 million to € 1,313.3 million. Non-current liabilities due to banks were largely unchanged at € 1,498.8 million – whereby reclassifications to current liabilities (in accordance with their maturity) were offset by the use of existing long-term credit facilities. The items deferred tax liabilities, non-current trade accounts payable, non-current contract liabilities (which mainly include payments received from customer contracts for which the performance has not yet been completely rendered), as well as non-current other accrued liabilities were also largely unchanged.
Development of equity
Capital stock | 194.0 | 194.0 | 0.0 |
Capital reserves | 1,966.2 | 1,954.7 | + 11.5 |
Accumulated profit | 2,835.8 | 2,562.6 | + 273.3 |
Treasury shares | -231.5 | -231.5 | - 0.0 |
Revaluation reserves | 1.3 | 0.6 | + 0.7 |
Currency translation adjustment | -15.7 | -12.9 | - 2.8 |
Equity attributable to shareholders of the parent company | 4,750.1 | 4,467.4 | + 282.7 |
Non-controlling interests | 548.3 | 455.7 | + 92.6 |
Total equity | 5,298.4 | 4,923.2 | + 375.2 |
in € million | Dec. 31, 2022 | Dec. 31, 2021 | Change |
Mainly as a result of the further increase in the Group’s accumulated profit, consolidated equity capital rose from € 4,923.2 million as of December 31, 2021 to € 5,298.4 million on December 31, 2022. In the fiscal year 2022, the Group’s accumulated profit rose from € 2,562.6 million to € 2,835.8 million and contains the past profits of the consolidated companies, insofar as they were not distributed. The consolidated equity ratio rose from 50.9% to 51.2%.
Net bank liabilities (i.e., the balance of bank liabilities and cash and cash equivalents) increased from € 1,712.6 million as of December 31, 2021 to € 2,115.0 million on December 31, 2022.
Multi-period overview: development of relative indebtedness
Net bank liabilities (1) / EBITDA | 1.57 | 1.28 | 1.27 | 1.31 | 1.68 |
Dec. 31, 2018 (IFRS 15) | Dec. 31, 2019 (IFRS 16) | Dec. 31, 2020 | Dec. 31, 2021 | Dec. 31, 2022 |
(1) Net bank liabilities = balance of bank liabilities and cash and cash equivalents
Further details on the objectives and methods of the Group’s financial risk management are provided under note 43 of the Notes to the Consolidated Financial Statements.
Multi-period overview: development of key balance sheet items
Total assets | 8,173.8 | 9,128.8 | 9,230.8 | 9,669.1 | 10,358.5 | ||||
Cash and cash equivalents | 58.1 | 117.6 | 131.3 | 110.1 | 40.5 | ||||
Shares in associated companies | 206.9 | 196.0 | 89.6 (1) | 431.6 (1) | 429.3 | ||||
Other financial assets | 348.1 | 90.4 (2) | 9.9 (2) | 11.6 | 10.7 | ||||
Property, plant and equipment | 818.0 | 1,160.6 (3) | 1,271.6 | 1,379.6 | 1,851.0 | ||||
Intangible assets | 1,244.6 | 2,167.4 (4) | 2,197.8 | 2,059.4 | 2,029.3 | ||||
Goodwill | 3,612.6 | 3,616.5 | 3,609.4 | 3,627.8 | 3,623.4 | ||||
Liabilities due to banks | 1,939.1 | 1,738.4 | 1,466.1 | 1,822.7 | 2,155.5 | ||||
Capital stock | 205.0 | 205.0 | 194.0 (5) | 194.0 | 194.0 | ||||
Equity | 4,521.5 | 4,614.7 | 4,911.2 | 4,923.2 | 5,298.4 | ||||
Equity ratio | 55.3% | 50.6% | 53.2% | 50.9% | 51.2% | ||||
in € million | Dec. 31, 2018 (IFRS 15) | Dec. 31, 2019 (IFRS 16) | Dec. 31, 2020 | Dec. 31, 2021 | Dec. 31, 2022 | ||||
(1) Decrease due to reclassification Tele Columbus (2019); increase due to stake in Kublai (2021)
(2) Decrease due to sale of Rocket Internet shares (2019); decrease due to sale of Afilias shares (2020)
(3) Increase due to initial application of IFRS 16 (2019)
(4) Increase due to initial recognition of acquired 5G frequencies (2019)
(5) Decrease due to withdrawal of treasury shares (2020)
Management Board’s overall assessment of the Group’s business situation
As a result of the war in Ukraine and the high inflation rate, the International Monetary Fund (IMF) downgraded its forecast for 2022 on several occasions during the year. In its latest economic outlook, the IMF reported growth of 3.4% for the global economy in 2022, based on preliminary calculations. Growth was thus significantly below the prior-year level (6.2%) and also 1.0 percentage points lower than the IMF’s original outlook in January 2022 (4.4%).
The IMF’s calculations for Germany are in line with the preliminary figures of the country’s Federal Statistics Office (Destatis), which forecast a 1.9% increase in (price-adjusted) gross domestic product (GDP) for 2022. This is 0.7 percentage points less than in 2021 (2.6%). According to estimates of the Federal Statistics Office, the macroeconomic situation in Germany in 2022 was dominated by the consequences of the war in Ukraine and, in particular, by extreme energy price increases. In addition, there were intensified material and supply bottlenecks, huge price increases, for example for food, as well as a shortage of skilled workers and the ongoing coronavirus pandemic – although this eased over the course of the year.
Thanks to its stable and largely non-cyclical business model, United Internet made good progress again in the fiscal year 2022 – despite the aforementioned adverse macroeconomic conditions. The Company was able to achieve the sales and earnings targets it set itself, continuing its successful development with an increase in fee-based customer contracts of 730,000 to 27.46 million and sales growth of 4.8% to € 5.915 billion. At the same time, there was a further improvement in operating EBITDA – despite heavy investment in future topics – with an increase of 0.7% to around € 1.272 billion. In addition to significantly higher electricity costs (€ -22.4 million), this at first glance only moderate EBITDA growth was mainly due to expenses for the construction of 1&1’s mobile communications network (€ -51.7 million; prior year: € -37.9 million) and costs for the announced additional marketing activities of IONOS to raise brand awareness in the most important European markets (€ -32.4 million).
This positive performance once again highlights the benefits of United Internet’s business model based predominantly on electronic subscriptions with fixed monthly payments and contractually fixed terms. This ensures stable and predictable revenues and cash flows, offers protection against cyclical influences and provides the financial scope to win new customers, expand existing customer relationships, and grasp opportunities in new business fields and new markets – organically or via investments and acquisitions.
In the fiscal year 2022, the Company once again invested heavily in gaining and expanding customer relationships, as well as in developing new products – thus laying the basis for future growth.
As of the reporting date for the Annual Financial Statements 2022, and at the time of preparing this Management Report, the Management Board believes that the United Internet Group as a whole is well placed for its further development. It regards the financial position and performance – subject to possible special items – as positive and is optimistic about the Group’s future prospects.